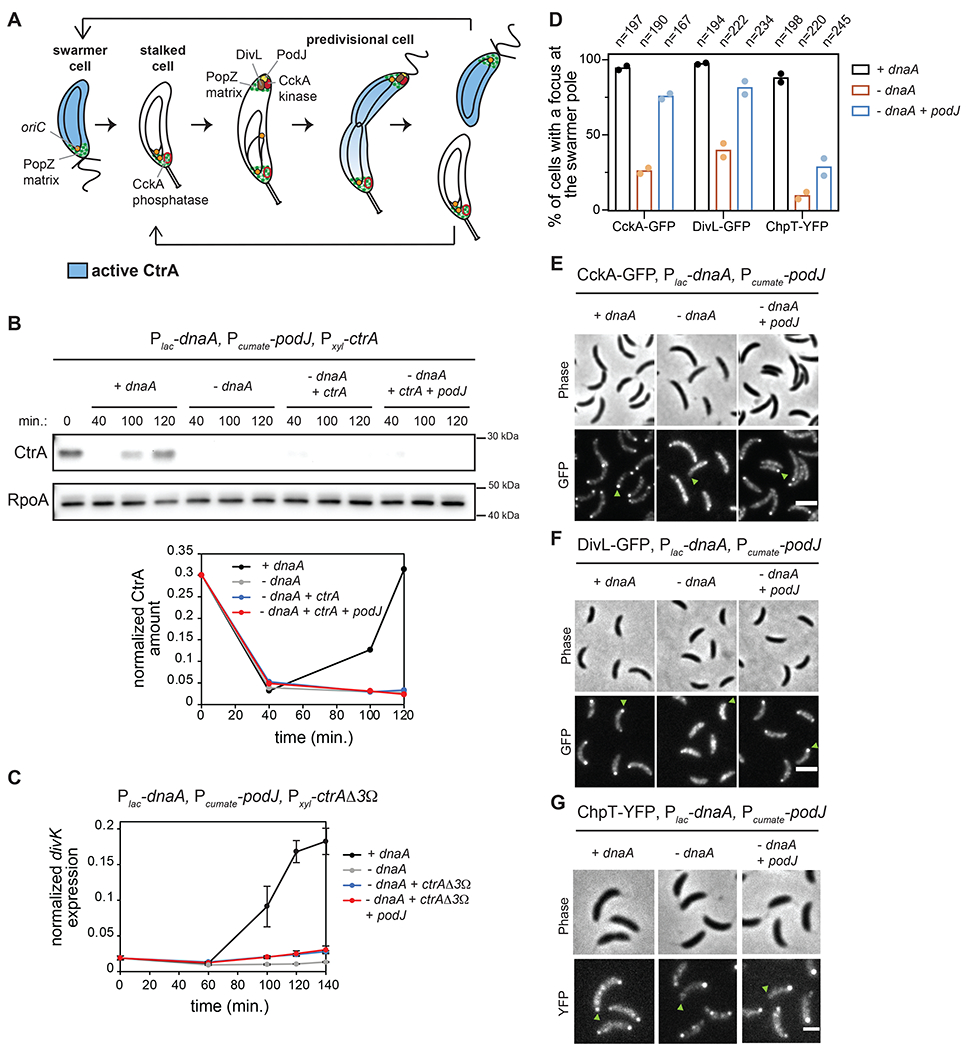
Figure 1: Polarization of CckA and DivL is not sufficient to activate CtrA if DNA replication is inhibited.

(A) Schematic of the C. crescentus cell cycle.
(B) CtrA immunoblots in synchronized cells expressing dnaA (+IPTG) or depleted of dnaA (-IPTG) with ectopic expression of ctrA (+0.075% xyl) and podJ (+cumate) when indicated. Times indicate minutes post-synchronization. Graph shows CtrA band intensity normalized to RpoA control.
(C) mRNA levels of the CtrA-activated gene divK measured by qRT-PCR and normalized to rpoA mRNA levels in cells expressing dnaA (+IPTG) or depleted of dnaA (-IPTG) with ectopic expression of the proteolytically stable mutant ctrAΔ3Ω (+0.075% xyl) and podJ (+cumate) when indicated. Data represent the mean ±SD of three biological replicates.
(D-G) Localization of CckA-GFP (E), DivL-GFP (F) and ChpT-YFP (G) in fixed cells (90 min. post-synchronization) expressing dnaA (+IPTG) or depleted of dnaA (-IPTG) with or without ectopic expression of podJ (+cumate). Green arrows: swarmer pole of one representative cell for each condition. (D) Percentage of cells with detectable foci of CckA-GFP, DivL-GFP, or ChpT-YFP at the swarmer pole in each condition. Bars indicate mean from two biological replicates shown as individual datapoints. Total number of cells from two biological replicates is indicated above. Scale bars = 2 μm.
