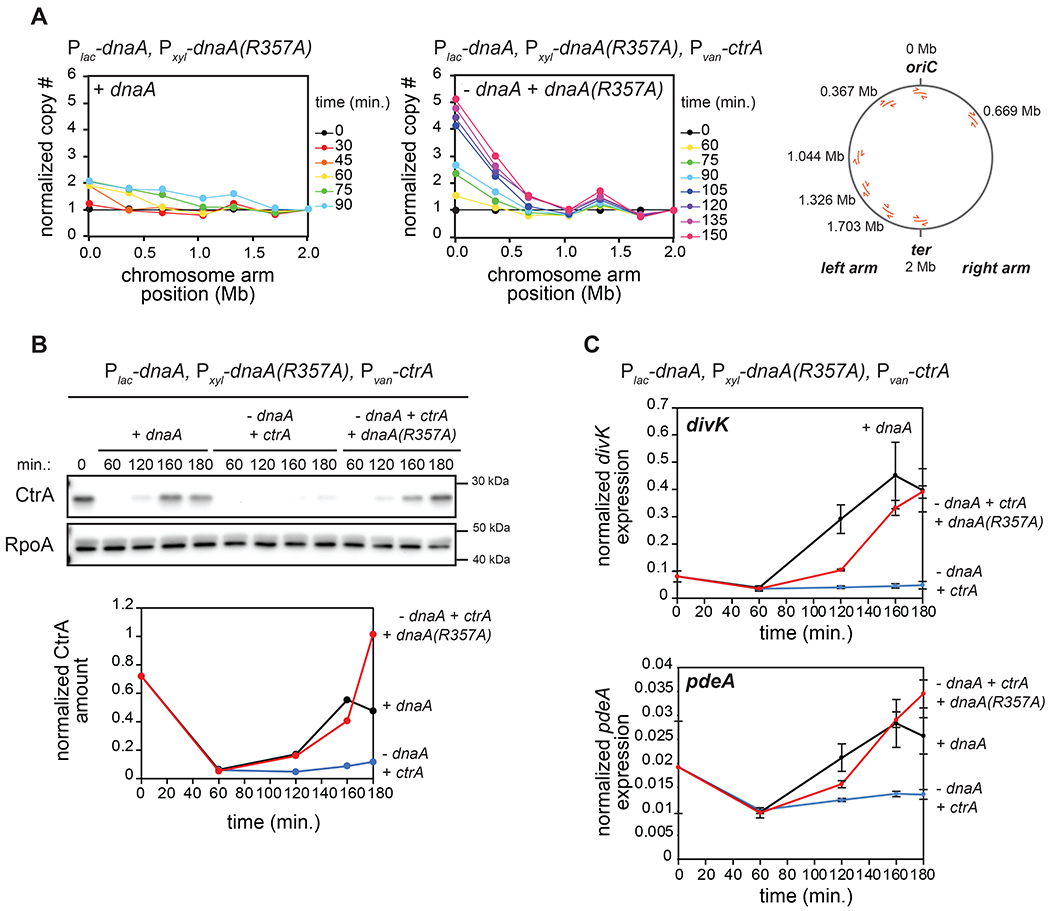
Figure 2: Replication of the full chromosome is not required for CtrA activation.

(A) qPCR on genomic DNA from cells expressing dnaA (+IPTG) or depleted of dnaA and expressing the dnaA(R357A) ATP-locked mutant (-IPTG +xyl) at different times post-synchronization. Map of C. crescentus chromosome (right) shows the localization of primers used. Samples were normalized to DNA levels close to the terminus and then normalized to t=0 min. to evaluate copy number. For the ‘+dnaA’ condition, samples after t=90 min. were excluded as DNA close to the terminus has been replicated.
(B) CtrA levels at the times indicated post-synchronization in cells expressing dnaA (+IPTG) or depleted of dnaA (-IPTG) with ectopic expression of wild-type ctrA (+van) and with (+xyl) or without ectopic expression of dnaA(R357A). Graph shows CtrA band intensity normalized to RpoA.
(C) mRNA levels of the CtrA-activated genes divK and pdeA measured by qRT-PCR and normalized to rpoA mRNA levels for cells treated as in (B). Data represent the mean ±SD of three biological replicates.
