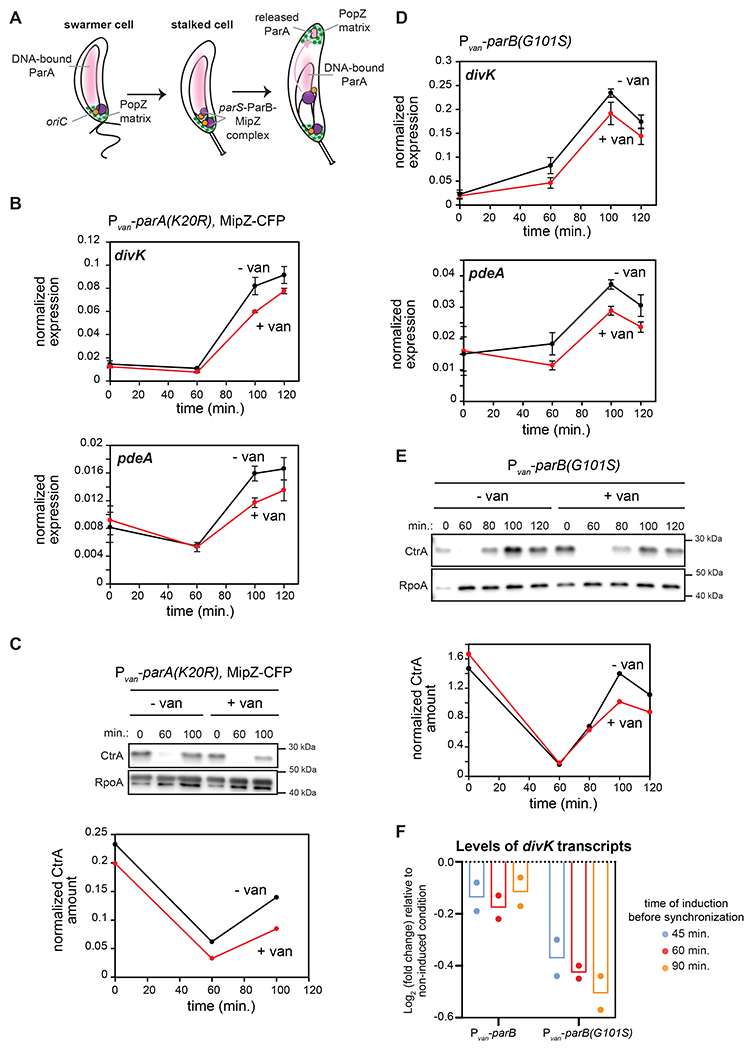
Figure 3: CtrA activation in predivisional cells is reduced when chromosome segregation is perturbed.

(A) Schematic of chromosome segregation during the C. crescentus cell cycle.
(B) mRNA levels of divK and pdeA measured as in Fig. 2C at the times indicated post-synchronization in cells expressing (+van) or not (-van) parA(K20R). parA(K20R) was induced 60 min. pre- and post-synchronization with 500 μM van. Data represent the mean ±SD of three biological replicates.
(C) CtrA levels at the times indicated post-synchronization in cells treated as in (B). Graph shows CtrA band intensity normalized to RpoA.
(D) mRNA levels of divK and pdeA measured as in Fig. 2C at the times indicated post-synchronization in cells expressing (+van) or not (-van) the spreading-deficient parB(G101S) mutant. parB(G101S) was induced 60 min. pre- and post-synchronization with 500 μM van. Data represent the mean ± SD of three biological replicates.
(E) CtrA levels at the times indicated post-synchronization in cells from the same conditions as in (D). Graph shows CtrA band intensity normalized to RpoA.
(F) Relative fold-change in mRNA levels of divK measured by qRT-PCR and normalized to rpoA mRNA levels 100 min. post-synchronization, when inducing parB or parB(G101S) 45, 60, or 90 min. pre-synchronization compared to the uninduced condition. Bars indicate mean from two biological replicates shown as individual datapoints.
