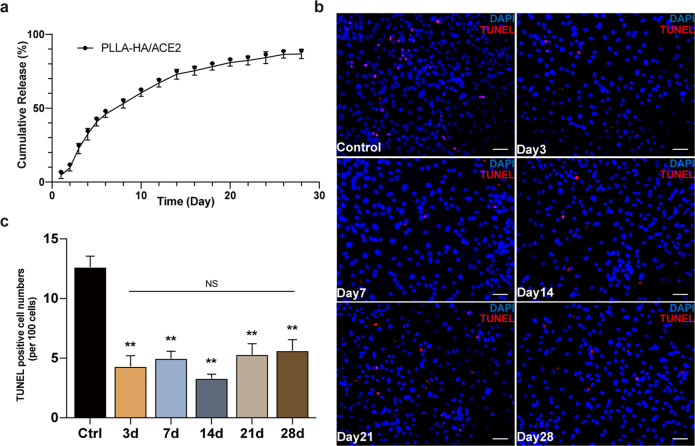
Fig. 5. rhACE2 patch sustained-release activity test.
a In vitro releasing curve of PLLA-HA/ACE2 fibrous membranes. b Releasing buffer collected at specified time points during release study was added into culture media of NRCMs undergone 6 h hypoxia. Representative immunofluorescence image of TUNEL (red) and nuclear visualized by DAPI (blue). Scale bars represented 50 μm. c Statistical analysis of TUNEL-positive cell counts. n = 3/group. Data were represented as the mean ± SEM and analyzed for statistical significance using One-way ANOVA followed by Tukey’s multiple comparison test; NS no significant difference; **P < 0.01 compared to the control group.

