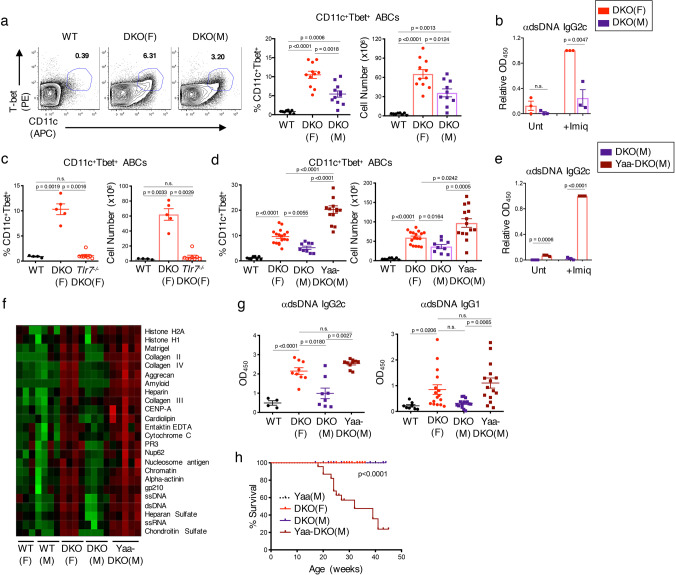
Fig. 1. TLR7 controls sex-specific differences in ABC formation and function.
a Representative FACS plots and quantifications of CD11c+Tbet+ ABCs (gated on B220+) from spleens of aged (24+wk) female C57BL/6 (WT) (black circles), female DKO (F) (red circles), and male DKO (M) mice (purple squares). Data shows mean ± SEM; n = 8 for WT, n = 11 for DKO(F), n = 10 for DKO(M) over 8 independent experiments; p-value by Brown–Forsythe and Welch ANOVA followed by Games–Howell’s test for multiple comparisons. b Pooled ELISA data for anti-dsDNA IgG2c antibodies from supernatants of sorted ABCs (B220+CD19+CD11c+CD11b+) from spleens of aged (24+wk) DKO(F) and DKO(M) mice after culturing with Imiquimod for 7d. Data shows mean ± SEM; n = 3; p-value by unpaired two-tailed t-tests. c Quantifications of CD11c+Tbet+ ABCs from the spleens of aged (24+wk) female WT, DKO(F), and female Tlr7-deficient DKO (Tlr7−/−.DKO(F)) mice (red open circles). Data show mean ± SEM; n = 4 for WT, n = 5 for DKO(F), n = 8 for Tlr7−/−.DKO(F) mice over 4 independent experiments; p-value by Brown–Forsythe and Welch ANOVA followed by Games–Howell’s test for multiple comparisons. d Quantifications of CD11c+Tbet+ ABCs (gated on B220+) from the spleens of aged (24+wk) WT, DKO(F), DKO(M), and male Yaa-DKO(M) mice (maroon squares). Data shows mean ± SEM; n = 8 for WT, n = 17 for DKO(F), n = 9 for DKO(M), n = 14 for Yaa-DKO(M) over 8 independent experiments; p-value by Brown–Forsythe and Welch ANOVA followed by Games–Howell’s test for multiple comparisons. e Pooled ELISA data for anti-dsDNA IgG2c antibodies from supernatants of sorted ABCs from aged (24+wk) DKO(M) or Yaa-DKO(M) mice after culturing with Imiquimod for 7d. Data shows mean ± SEM; n = 3; p-value by unpaired two-tailed t-tests. f Autoantigen microarray showing the relative autoantibody levels in the serum of aged (24+wk) female WT (F), male WT (M), DKO(F), DKO(M), and Yaa-DKO(M) mice; n = 3 for WT(F), n = 4 for WT(M), DKO(F), and DKO(M), n = 5 for Yaa-DKO(M). g Pooled ELISA data for anti-dsDNA IgG2c and IgG1 in the serum from the indicated aged (24+wk) mice. Data shows mean ± SEM; for anti-dsDNA IgG2c, n = 4 for WT, n = 9 for DKO(F), n = 8 for DKO(M), n = 10 for Yaa-DKO(M); for anti-dsDNA IgG1, n = 8 for WT, n = 16 for DKO(F), n = 14 for DKO(M); n = 15 for Yaa-DKO(M); p-value by Brown–Forsythe and Welch ANOVA followed by Games–Howell’s test for multiple comparisons. h Plot showing survival rate of Yaa control, DKO(F), DKO(M), and Yaa-DKO(M) mice across 45 weeks. Data represents a cohort of 14 Yaa control, 16 DKO(F), 9 DKO(M), and 31 Yaa-DKO(M) mice; p-value by Mantel–Cox test.

