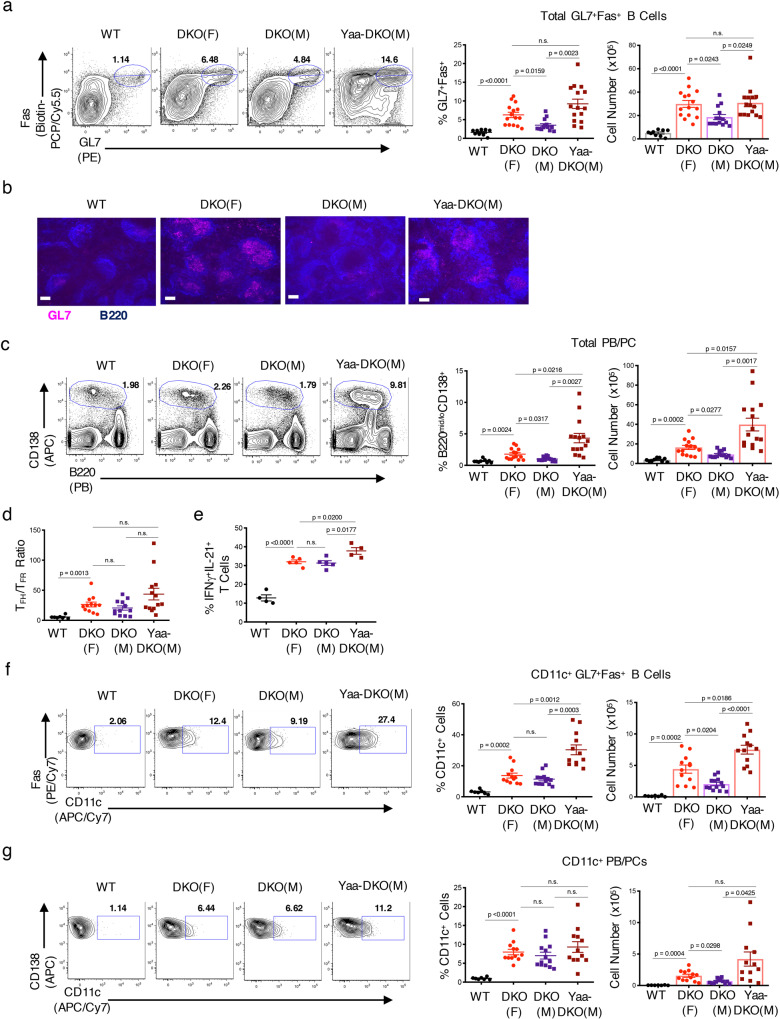
Fig. 2. Sex-dependent accumulation of GC B cells and PB/PCs in DKO mice.
a Representative FACS plots and quantifications of total GC B cells (gated on B220+ GL7+Fas+ splenocytes) from aged (24+wk) female C57BL/6 (WT) (black circles), female DKO(F) (red circles), male DKO(M) (purple squares), and male Yaa-DKO(M) mice (maroon squares). Data show mean ± SEM; n = 9 for WT, n = 15 for DKO(F) and Yaa-DKO(M), n = 14 for DKO(M) over 9 independent experiments; p-value by Brown–Forsythe and Welch ANOVA followed by Games–Howell’s test for multiple comparisons. b Representative immunofluorescence images of B220+ (blue) GL7+ (pink) GCs in spleens from the indicated mice. Data representative of at least 4 frames for at least 2 mice per genotype. Bars show 50 μm. c Representative FACS plots and quantifications of total PB/PC (B220mid/loCD138+) in spleens of the indicated mice. Data show mean ± SEM; n = 9 for WT, n = 14 for DKO(F) and DKO(M), n = 15 for Yaa-DKO(M) over 9 independent experiments; p-value by Brown–Forsythe and Welch ANOVA followed by Games–Howell’s test for multiple comparisons. d Quantification of the FACS plots showing TFH (CD4+ PD1hiCXCR5+ Foxp3−) to TFR (CD4+ PD1hiCXCR5+ Foxp3+) ratio in spleens from the indicated mice. Data show mean ± SEM; n = 7 for WT, n = 12 for DKO(F) and DKO(M), n = 13 for Yaa-DKO(M) over 7 independent experiments; p-value by Brown–Forsythe and Welch ANOVA followed by Games–Howell’s test for multiple comparisons. e Quantification of FACS plots showing IFNγ+IL-21+ T cells in spleens of the indicated mice following 4 h treatment of splenocytes with PMA/Ionomycin. Data show mean ± SEM; n = 4 for WT and Yaa-DKO(M), n = 5 for DKO(F) and DKO(M) over 4 independent experiments; p-value by Brown–Forsythe and Welch ANOVA followed by Games–Howell’s test for multiple comparisons. f, g Representative FACS plots and quantifications of CD11c+ GL7+Fas+ cells (gated on B220+ splenocytes) (f) or CD11c+ PB/PC (B220mid/loCD138+) (g) from the indicated mice. Data show mean ± SEM; n = 7 for WT, n = 12 for DKO(F) and Yaa-DKO(M), n = 3 for DKO(M) over 7 independent experiments; p-value by Brown–Forsythe and Welch ANOVA followed by Games–Howell’s test for multiple comparisons.

