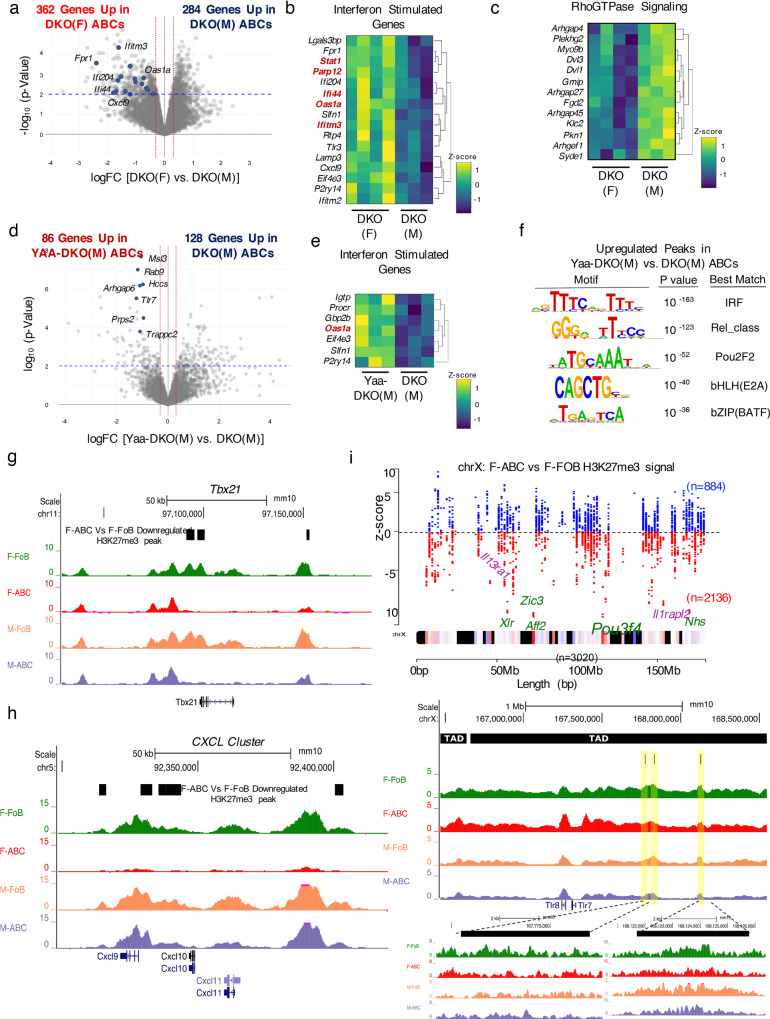
Fig. 4. DKO ABCs upregulate ISGs in a sex-specific manner.
a–e RNA-seq analyses were performed on sorted ABCs (B220+CD19+CD11c+CD11b+) from aged (24+wk) female DKO (F), male DKO (M), and male Yaa-DKO (M) mice. a Volcano plot showing differentially expressed genes (p < 0.01 after Benhamini-Hochberg false discovery rate (FDR) was used to correct for multiple comparisons) in ABCs from DKO(F) and DKO(M) mice. Genes in blue show Interferon Stimulated Genes (ISGs) represented in Fig. 4b. b Heatmap showing the differential expression of ISGs in ABCs from DKO(F) and DKO(M) mice. c Heatmap showing differentially expressed genes in the REACTOME_RhoGTPase_CYCLE geneset. d Volcano plot showing differentially expressed genes (p < 0.01 after Benhamini–Hochberg false discovery rate (FDR) was used to correct for multiple comparisons) in ABCs from Yaa-DKO(M) mice and DKO(M) mice. Genes in blue show genes on the Yaa translocation. e Heatmap showing the differential expression of ISGs in ABCs from Yaa-DKO(M) and DKO(M) mice. f ATAC-seq was performed on ABCs from aged (24+wk) DKO(F), DKO(M), and Yaa-DKO(M) mice. Motif enrichment analysis in ATAC-seq peaks that are significantly upregulated (logFC >1.5; EdgeR, QLF FDR <0.05) in ABCs from Yaa-DKO(M) as compared to DKO(M) mice. g–i CUT&RUN for H3K27me3 marks was performed on ABCs from aged (24+wk) DKO(F) and DKO(M) mice. g, h Representative UCSC genome browser tracks of H3K27me3 marks for Tbx21 gene (g) and CXCL gene cluster (h; Cxcl9, Cxcl10 & Cxcl11). The black boxes in each of the browser track represents genome co-ordinates of significantly downregulated H3K27me3 peaks from DKO(F) ABCs as compared to DKO(F) FoBs (2-fold down and = <0.05 FDR). i X-chromosome map of 3092 H3K27me3 peaks across the length the chromosome where each dot represents a H3K27me3 peak. Black bands on X-chromosome are devoid of H3K27me3 signal and the color spectrum represents various H3K27me3 peaks. The z-score (X-chromosome inactivation score) is a DESeq2 Wald statistic showing gain or loss of H3K27me3 signal across 3092 peaks. A total of 2135 peaks had negative z-scores (downregulated) in DKO(F) ABCs as compared to DKO(F) FoBs and 884 had positive z-scores (upregulated). Genome browser track of H3K27me3 signals over the Tlr7 locus, highlighted in yellow are the downregulated H3K27me3 peaks in DKO(F) ABCs. The black boxes on the top represent TAD boundaries on the X-chromosome called by machine-learning program Peakachu88 obtained from a murine B cell lymphoma CH1289.

