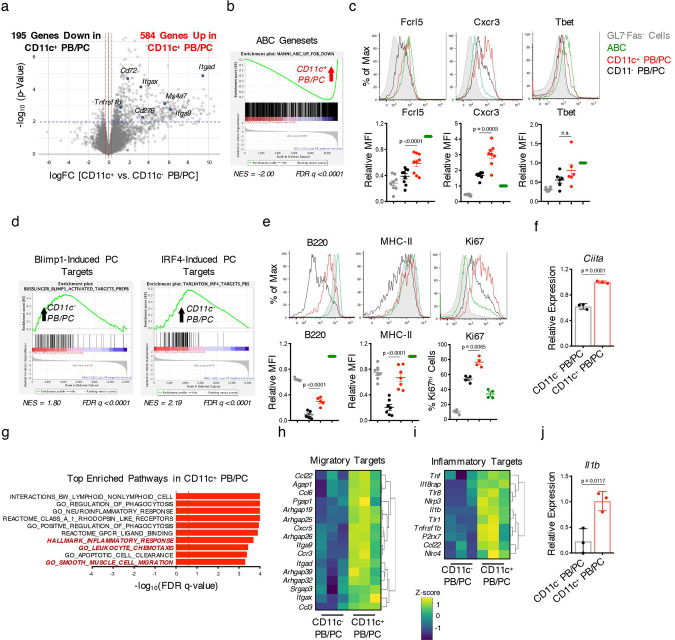
Fig. 6. Expansion of CD11c+ PBs in DKO females.
a RNA-seq was performed on sorted CD11c+ and CD11c− PB/PCs (CD138+TACI+) from aged (24+wk) female DKO (F) mice. Volcano plot showing differentially expressed genes (p < 0.01 after Benhamini-Hochberg false discovery rate (FDR) was used to correct for multiple comparisons) between CD11c+ and CD11c− PB/PCs. Blue dots indicate ABC target genes upregulated in CD11c+ PB/PCs. b Plot showing the enrichment of the ABC geneset from DKO mice in CD11c+ PB/PCs. c Representative histograms and quantifications of Fcrl5, Cxcr3, and Tbet in CD11c+ PB/PCs (CD19mid/loCD138+; red) and CD11c− PB/PCs (black) from aged (24+wk) DKO(F) mice. CD19+CD11c+CD11b+ (ABCs) (green) and CD19+GL7−Fas− cells (gray) are shown as controls. Data show mean ± SEM; n = 6 for Tbet, n = 8 for CXCR3, n = 9 for FcRL5 over 3–5 independent experiments; p-value by paired two-tailed t-tests. d Plots showing the enrichment of Blimp1-induced74 and IRF4-induced target genes in CD11c− PB/PCs by GSEA. e Representative histograms and quantifications of B220, MHC-II, and Ki67 expression in the indicated populations from aged (24+wk) DKO(F) mice. Data show mean ± SEM; n = 4 for Ki67, n = 5 for B220, n = 7 for MHC-II over 2–3 independent experiments; p-value by paired two-tailed t-tests. f Representative RT-qPCR showing Ciita expression in CD11c+ or CD11c− PB/PCs sorted from aged (24+wk) DKO(F) mice as in Fig. 6a. Data representative of 3 independent experiments and show mean ± SD; n = 3; p-value by unpaired two-tailed t-test. g Plot showing the top pathways enriched in CD11c+ PB/PCs as compared to CD11c− PB/PCs by GSEA. Dotted line indicates significance threshold at FDR q < 0.25. h, i Heatmap showing the expression of migratory (h) and inflammatory target genes (i) that are differentially expressed (p < 0.01) between CD11c+ and CD11c− PB/PCs in DKO(F) mice from Fig. 6a. j Representative RT-qPCR showing Il1b expression in CD11c+ or CD11c− PB/PCs sorted from aged (24+wk) DKO(F) mice as in Fig. 6a. Data representative of 3 independent experiments and show mean ± SD; n = 3; p-value by unpaired two-tailed t-test.

