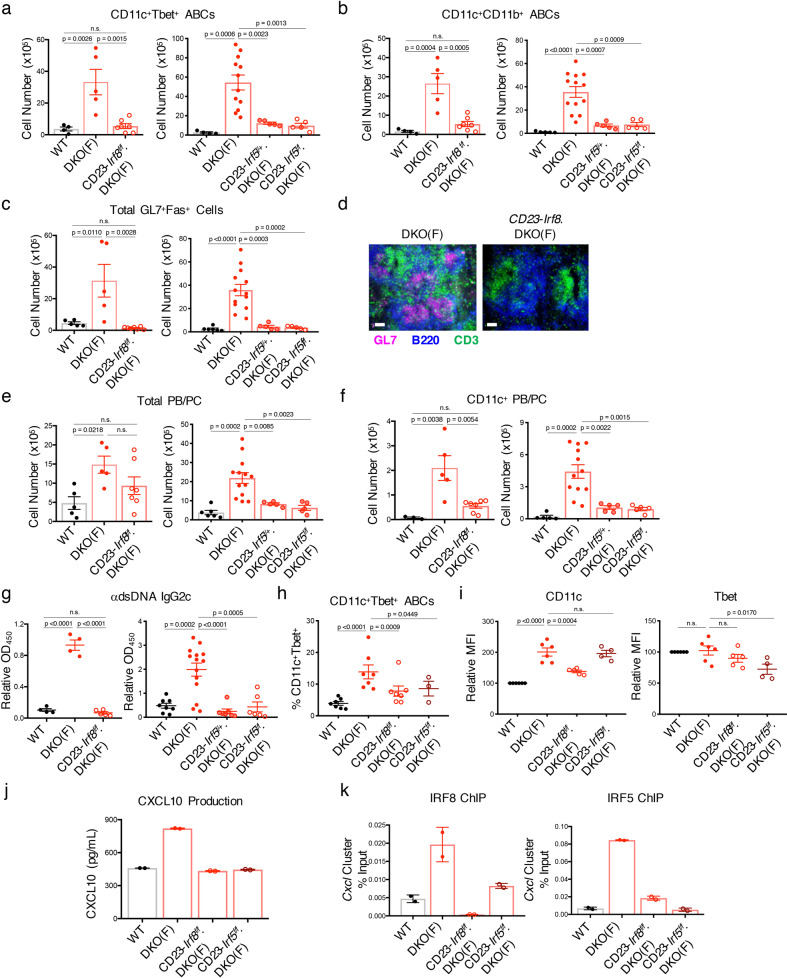
Fig. 8. IRF8 and IRF5 are required for ABC differentiation in DKO females.
a–c Quantifications showing the numbers of CD11c+Tbet+ ABCs (a), CD11c+CD11b+ ABCs (b), and total GL7+Fas+ B cells (c) from the spleens of aged (24+wk) female C57BL/6 (WT), female DKO(F), female CD23-Irf8.DKO(F), female CD23-Irf5f/+.DKO(F), and female CD23-Irf5f/f.DKO(F) mice. Data show mean ± SEM; n = 4 for WT, n = 5 for DKO(F), CD23-Irf5f/+.DKO(F), and CD23-Irf5.DKO(F), n = 7 for CD23-Irf8.DKO(F), n = 12 for DKO(F) over 6–7 independent experiments; p-value by 1-way ANOVA followed by Tukey’s test for multiple comparisons. d Representative immunofluorescence images of B220 (blue), GL7 (pink), and CD3 (green) on the indicated mice. Data representative of 4 mice per genotype. Bars show 50 μm. e, f Quantifications showing the numbers of total PB/PCs (e; B220mid/loCD138+) and CD11c+ PB/PCs (f) from the indicated aged (24+wk) mice. Data show mean ± SEM; n = 5/6 for WT, n = 5/13 for DKO(F), n = 7 for CD23-Irf8.DKO(F), n = 5 for CD23-Irf5f/+ (e); n = 3/5 for WT, n = 5/12 for DKO(F), n = 7 for CD23-Irf8.DKO(F), n = 5 for CD23-Irf5f/+ (f) over 6–7 independent experiments; p-value by 1-way ANOVA followed by Tukey’s test for multiple comparisons. g ELISA data showing anti-dsDNA IgG2c in the serum from the indicated aged (24+wk) mice. Data show mean ± SEM; n = 4/8 for WT, n = 4/14 for DKO(F), n = 5 CD23-Irf8.DKO(F), n = 7 for CD23-Irf5+/-.DKO(F), n = 6 for CD23-Irf5f/f.DKO(F); p-value by 1-way ANOVA followed by Tukey’s test for multiple comparisons. h–k CD23+ B cells from the indicated young (8–12wk) mice were stimulated for 2–3d with αIgM, αCD40, and IL-21. h Quantification of CD11c+Tbet+ B cells after 3d culture. Data show mean ± SEM; n = 7 for WT, DKO(F), and CD23-Irf8.DKO(F), n = 3 for CD23-Irf5.DKO(F); p-value by 1-way ANOVA followed by Tukey’s test for multiple comparisons. i Quantifications showing the expression of CD11c and Tbet in the indicated strains after 3d culture as in Fig. 4h. Data show mean ± SEM; n = 6 for WT and DKO(F), n = 5 for CD23-Irf8.DKO(F), n = 4 for CD23-Irf5.DKO(F); p-value by 1-way ANOVA followed by Tukey’s test for multiple comparisons. j ELISA data showing CXCL10 production in the supernatants after 3d culture as in Fig. 4h. Data representative of 3 independent experiments and show mean ± SD. k Representative ChIP-qPCR of IRF8 and IRF5 binding at the Cxcl cluster in the indicated young (8–12wk) mice. Data representative of 3 independent experiments and show mean ± SD.

