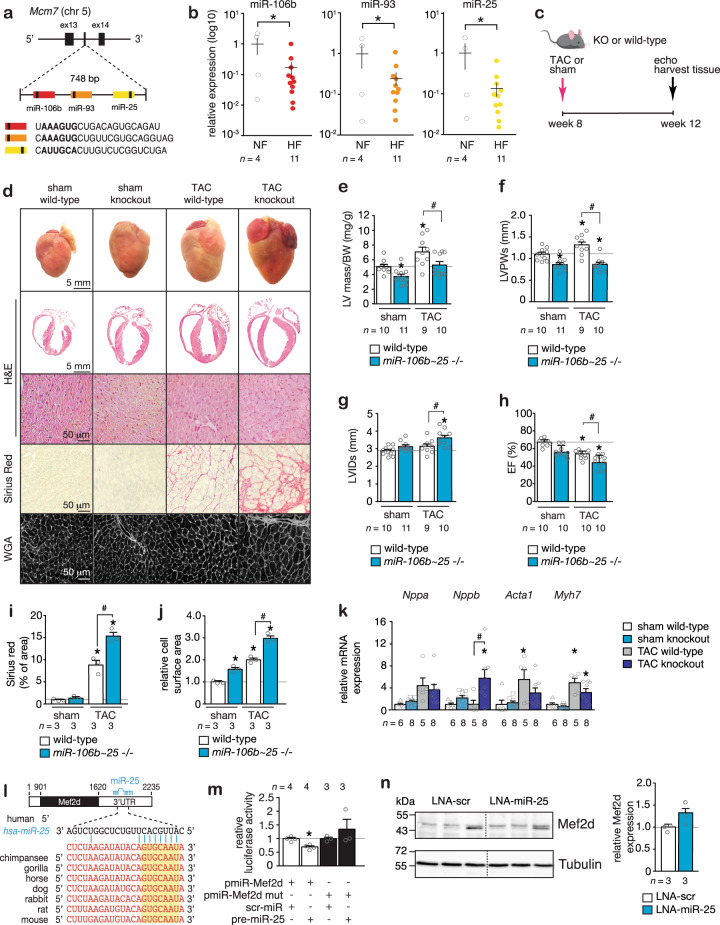
Fig. 1. miR-106b~25 gene deletion induces hypertrophic cardiac remodeling.
a A schematic representation of the mouse Mcm7 gene harboring the miR-106b~25 cluster in intron 13. b Real-time PCR analysis of miR-106b, miR-93, and miR-25 abundance in human non-failing or failing myocardium. c Design of the study. d Representative images of whole hearts (top panels), haematoxylin & eosin (H&E)-stained sections of four-chamber view (second panel), high magnification H&E sections (third panel), Sirius Red stained sections (fourth panel), and wheat germ agglutinin (WGA)-stained (fifth panel) histological sections. Quantification of e left ventricular mass/body weight (BW) ratio, f left ventricular posterior wall thickness in systole (LVPWs), g Left ventricular internal diameter in systole (LVIDs), h ejection fraction (EF). i Quantification of the fibrotic area by Sirius Red staining and j cell surface areas by wheat germ agglutinin (WGA) staining. k Real-time PCR analysis of Nppa, Nppb, Acta1, and Myh7, n refers to number of animals. l Location and evolutionary conservation of hsa-miR-25 seed region on Mef2d. m Activity assay of luciferase reporter constructs shows the binding of hsa-miR-25 to the 3′UTR of Mef2d, n refers to number of transfection experiments. n Western blot analysis of endogenous Mef2d and GAPDH as a loading control in hearts from wild type (WT) versus miR-106b~25 knock-out (KO) mice, n refers to number of hearts. *P < 0.05 vs corresponding control group; #P < 0.05 vs corresponding treatment (error bars are s.e.m.). Statistical analysis consisted of a two-tailed Student’s t-test (b, m, n) or a One-way ANOVA followed by Dunnett multiple comparison test (e–k). Source data are provided as a Source data file.

