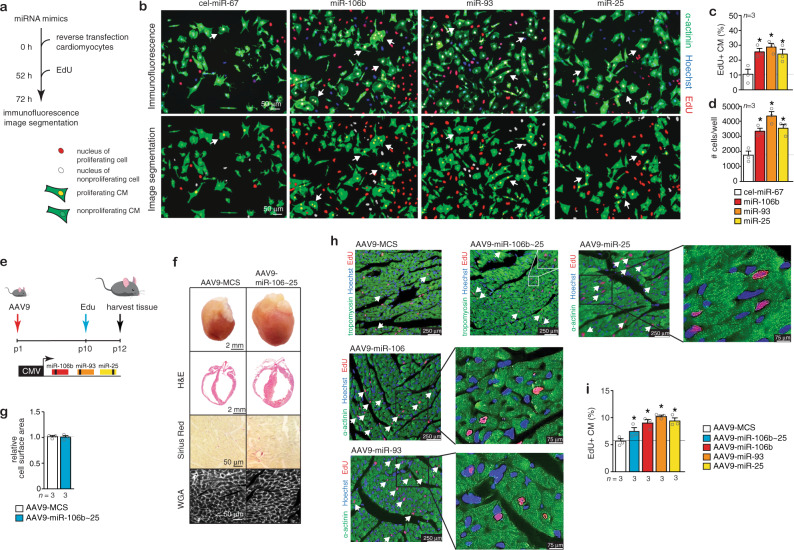
Fig. 3. Overexpression of the miR-106b~25 cluster induces cardiomyocyte (CM) proliferation.
a Workflow of the experiment. b Representative fluorescent microscopic images of rat CMs transfected with a control precursor miRNA, or precursors for miR-106b, miR-93, or miR-25 and stained for α-actinin, 5-ethynyl-2’-deoxyuridine (EdU), and Hoechst. Quantification of c the number of proliferating CMs (α-actinin+, EdU+) and d total number of CMs (α-actinin+) after transfection with a control miRNA, or miR-106b, miR-93, or miR-25, n refers to the number of transfection experiments. e Workflow of the study. f Representative images of whole hearts (top panels), H&E-stained sections in four-chamber view (second panel), Sirius Red stained sections (third panel) and WGA-stained (fourth panel) sections. g Quantification of the cell surface areas from WGA-stained sections. h Confocal microscopy images of heart sections of mice treated with AAV9-MCS or AAV9-miR-106b~25 and stained for α-actinin, EdU and Hoechst or α-actinin, pH3 and Hoechst. Quantification of i the number of proliferating CMs (α-actinin+, EdU+) and j the number of phospho-histone 3 (pH3) positive CMs (α-actinin+, pH3+), n refers to number of hearts. *P < 0.05 vs corresponding control group (error bars are s.e.m.). Statistical analysis consisted of a two-tailed Student’s t-test (g) or a One-way ANOVA followed by Dunnett multiple comparison test (c, d, i). Source data are provided as a Source data file.

