Figure 1.
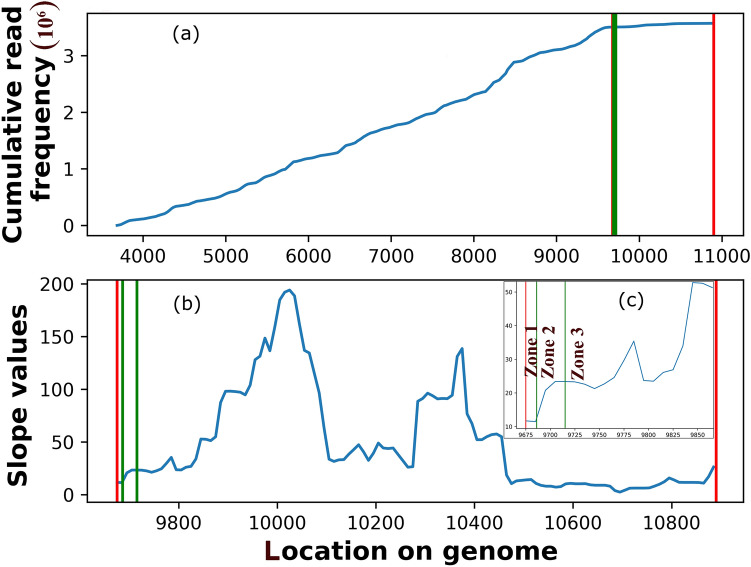
Defining IR and the positive slope region for screening a termination site. (a) A plot showing the cumulative distribution of the reads in and around an IR in S. aureus Newman, NCBI ID: NC_009641, RNA-seq ID: ERR1337989 for operon: [3686,9675,10900], where 3686–9675 is the coding region and 9675–10,900 is the IR marked by red lines. The blue curve shows the cumulative frequency of RNA-seq reads at each position in the above-mentioned operon. The numbers on the x-axis represent the actual genome coordinates. (b) The IR region for operon where slopes have been calculated from cumulative frequency values in a) using a window of 10 bases. A region of positive slope implies an increase in reads frequency after the previous drop. Red lines approximately mark the start and end of the IR (IRstart and IRend). The green lines mark the start and end of the first positive slope region (posst and posend, respectively) of the curve, indicating the end of transcription should be before this first read-increase region. (c) The inset around the transcription termination region is shown schematically divided into three zones; Zone 1: stop codon to start of the positive slope region; Zone 2: start of the positive slope region to end of the positive slope region; Zone 3: end of the positive slope region to the end of the IR.

