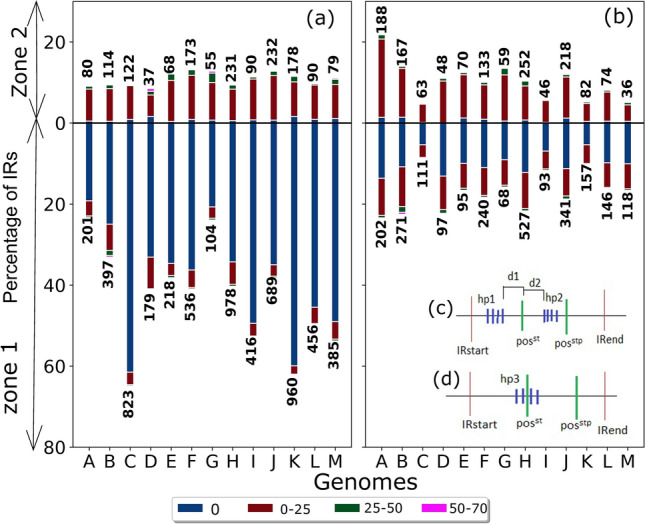
Figure 4.

Zonal distance distribution of RNA-seq derived cluster and single hairpin units. Bars show the distribution of RNA-seq derived hairpin units with respect to distance from posst for the cluster (a) and single (b) units as per in zone location. The different window sizes (represented by different colors) show the different distances from posst and their corresponding percentages on the y-axis. The total IRs from which percentage has been calculated for each of the genomes A–M on the x-axis are given on top of each bar for Zone 2 and at bottom of each bar for Zone 1. The x-axis labels show the 13 analyzed genomes, as indicated in Table 1. The total number of hairpins contributing to each bar is shown on the top/bottom of each bar. There are 111 transcription units where the hairpin is located > 75 bases from the posst; these are not shown in the plot. (c) For shortest distance calculation, if hairpin (hp) is in Zone 1 (between IR start and posst), then n is calculated as the distance between the last hairpin in cluster unit (last blue line in hp1 cluster) to posst. So d1 in the image is ‘n’ for zone 1 hairpins. If hairpin in Zone 2 (between posst and posstp), then n is calculated as the distance between posst and the first hairpin of cluster unit (first blue line in hp2 cluster). So d2 in the image is ‘n’ for Zone 2 hairpins. (d) The cluster hairpin hp3 lies in Zone 1 and Zone 2. In such a case, we assign n = 0.
