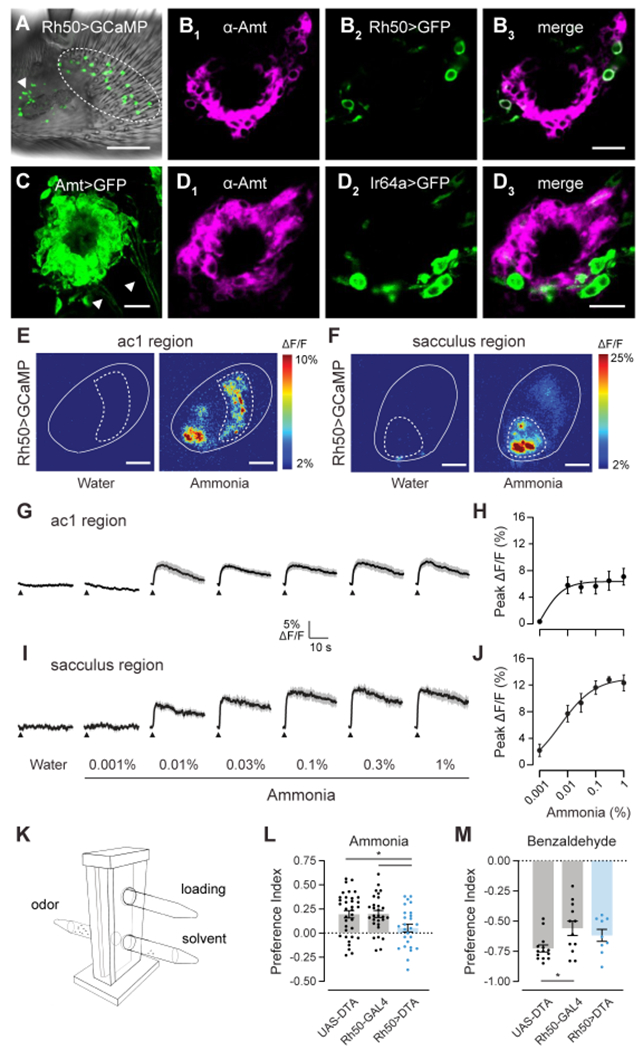
Figure 3. Two populations of Amt/Rh50+ ORNs mediate ammonia sensing.

(A) Whole mount image of an antenna from an Rh50>GCaMP7s fly. Rh50+ neurons (green) are found on the ac1 region of the antennal surface (dotted circles) and surrounding the sacculus (arrowhead). Scale bar, 30 μm.
(B) Close-up view of sacculus chamber III in an antennal section from an Rh50>GFP fly stained with anti-Amt (magenta, B1) and anti-GFP (green, B2). B3, merged image. Scale bar, 10 μm.
(C) High gain confocal image of sacculus chamber III in an antennal section from an Amt>GFP fly stained with anti-GFP. Labeled axons (arrowheads) emerge from clusters of GFP+ cells. Scale bar, 10 μm.
(D) Immunostaining for Amt (magenta, D1) and GFP (green, D2) on antennal sections from Ir64a>GFP flies. D3, merged image. Scale bar, 10 μm.
(E) Pseudocolored heat maps of calcium responses in the ac1 region (dotted circle) of the antenna (solid outline) of Rh50>GCaMP7s flies to either water or 0.1% ammonia. Scale bars, 30 μm.
(F) Similar to (E) but acquired at a different depth and location to focus on the sacculus region (dotted circle). Scale bars, 30 μm.
(G) Traces of the mean calcium responses (black) ± SEM (gray) in the ac1 region. Arrowheads indicate time when the 250 ms odor stimulus was applied (n=6-7 flies).
(H) Dose-response curve of the peak ac1 calcium responses.
(I and J) Similar to G and H, except for the sacculus region.
(K) T-maze assay schematic showing the elevator in the lower position with flies moving between the odor and solvent arms. The loading tube is above and is accessible with the elevator in the upper position.
(L and M) Preference indices of Rh50>DTA, UAS-DTA and Rh50-GAL4 flies when given the choice between ammonia and water (L) or between benzaldehyde and paraffin oil (M). Each dot represents one assay (n=26-35 ammonia, n=9-12 benzaldehyde).
See also Figure S2.
