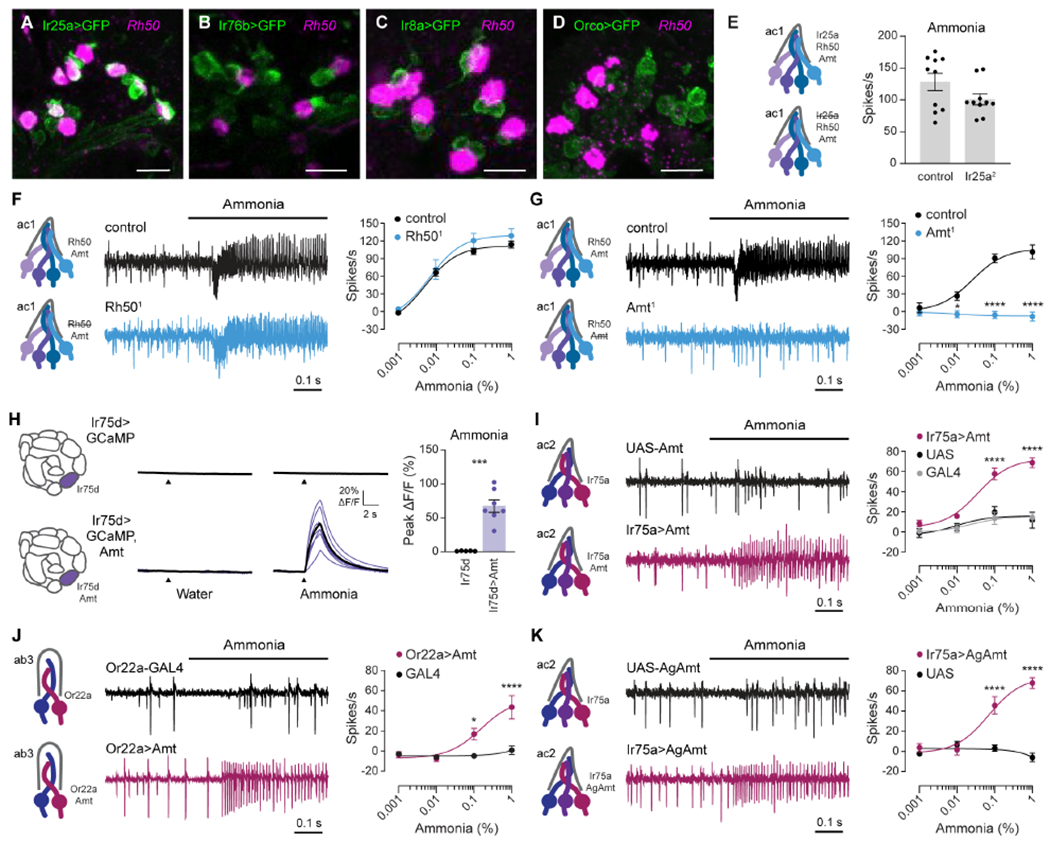
Figure 4. Amt transporter serves as an olfactory receptor for ammonia.

(A-D) Confocal images of antennal sections labeled with an antisense probe for Rh50 (magenta) and an antibody against GFP (green) driven by Ir25a-GAL4 (A), Ir76b-GAL4 (B), Ir8a-GAL4 (C), or Orco-GAL4 (D). Scale bars, 10 μm.
(E) Action potential responses to 0.1% ammonia in ac1 sensilla in control flies and Ir25a2 mutants (n=10 sensilla).
(F and G) Action potential responses to ammonia in ac1 sensilla in Rh501 (F) and Amt1 (G) mutants (blue) and control flies (black). Left, representative traces of response to 0.1% ammonia. Right, dose-response curves (n=8-10 sensilla).
(H) Left, antennal lobe calcium responses to water and 0.01% ammonia in axon termini of Ir75d>GCaMP6s flies, with (purple) and without (black) ectopic expression of Amt. Purple lines are responses in individual flies, and black lines are mean responses. Right, quantification of peak responses (n=5 and 7 flies).
(I) Action potentials elicited by ammonia in ac2 sensilla in Ir75a>Amt (crimson), Ir75a-GAL4 (grey) and UAS-Amt (black) flies. Left, sample traces of 1% ammonia responses. Right, dose-response curves (n=7-9 sensilla).
(J) Action potentials elicited by ammonia in ab3 sensilla in Or22a>Amt (crimson) and Or22a-GAL4 (black) flies. Left, sample traces of 1% ammonia responses. Right, dose-response curves (n=9-11 sensilla).
(K) Similar to (I), except Ir75a>AgAmt (crimson) and UAS-AgAmt (black) flies (n=7-8 sensilla).
See also Figure S3.
