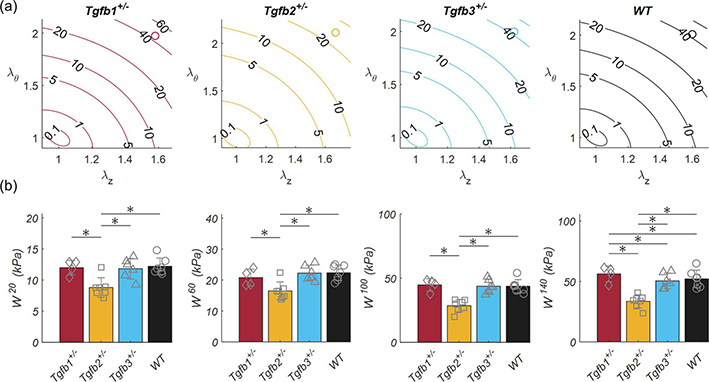
Figure 6.
Stored elastic energy of ascending aortas shown as (top) contour plots with open circles at in vivo conditions and (bottom) discrete values of stored energy taken at 20, 60, 100, and 140 mmHg taken from Tgfb1+/− (red), Tgfb2+/− (yellow), Tgfb3+/− (blue) and (d) wild-type (WT; black) mice. * Denotes statistical significance between groups at p<0.05.

