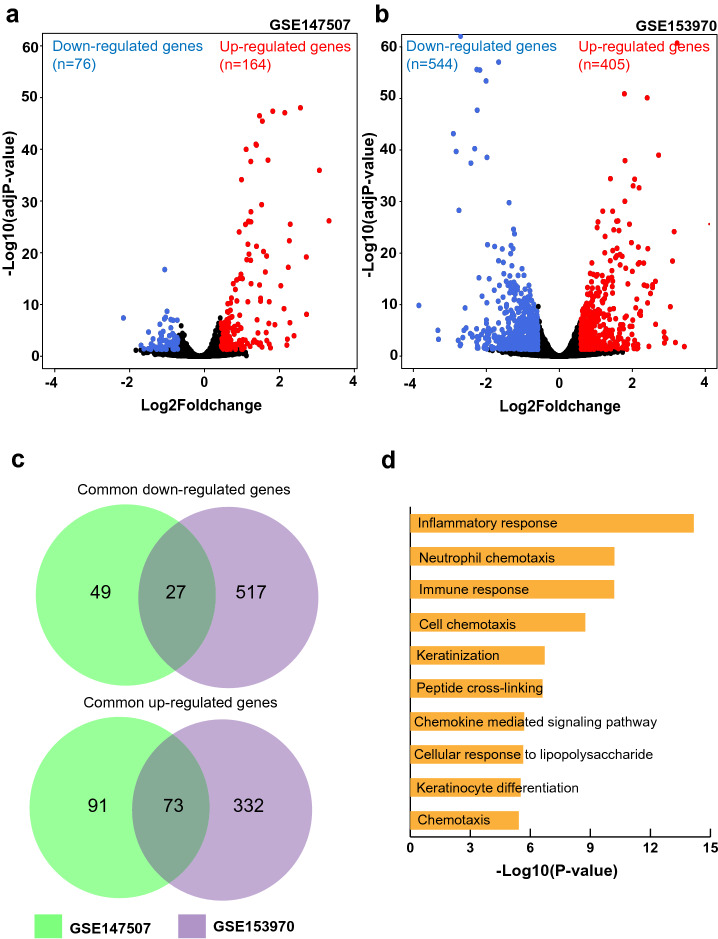
Figure 1.
High throughput gene expression analysis of SARS-CoV-2 infection in human lung epithelial cells. (a,b) Volcano plots showing the proportion of differentially expressed genes on SARS-CoV-2 infection in human lung epithelial cells [from GSE147507 and GSE153970, respectively]. (c) Venn diagram depicting genes commonly up-/down-regulated as per both studies. (d) Top 10 biological processes associated with common differentially expressed genes on SARS-CoV-2 infection of human lung epithelial cells.

