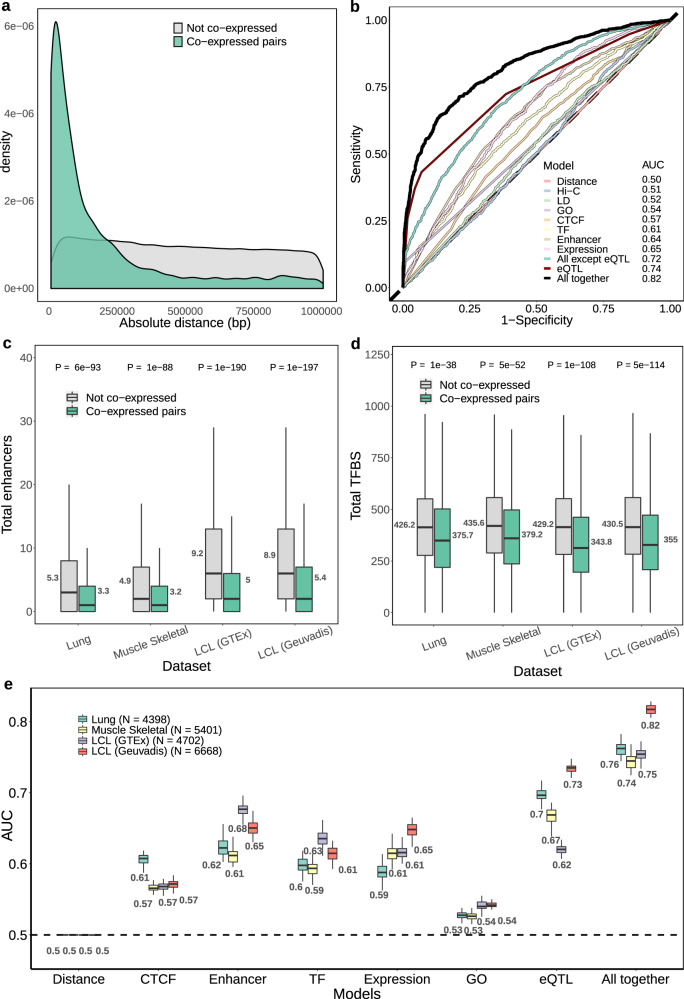
Fig. 3. Molecular features of COPs.
a Distribution of the absolute distance between TSS for Geuvadis LCL COPs and non-COPs. Gene pairs before applying paralog and positive correlation filters. b Receiver operating characteristic (ROC) curve of predicting Geuvadis LCLs COPs for several molecular features (logistic regression; N = 6668 for COPs and for non-COPs; see the “Methods” section for molecular feature descriptions). c and d boxplots of total enhancers and total transcription factor binding sites (TFBS), respectively, between COPs and non-COPs across four datasets: Geuvadis LCLs (N = 6668), GTEx LCLs (N = 4702), Lung (N = 4398) and Muscle Skeletal (N = 5401). Values next to the boxplots represent the mean. P-values were obtained from two-tailed Wilcoxon signed-rank tests. e Boxplots of the AUC values obtained for each molecular feature and dataset across the 50 training-test set randomisations. Values below each boxplot represent the mean AUC. For each boxplot, the length of the box corresponds to the interquartile range (IQR) with the centre line corresponding to the median, the upper and lower whiskers represent the largest or lowest value no further than 1.5 * IQR from the third and first quartile, respectively.

