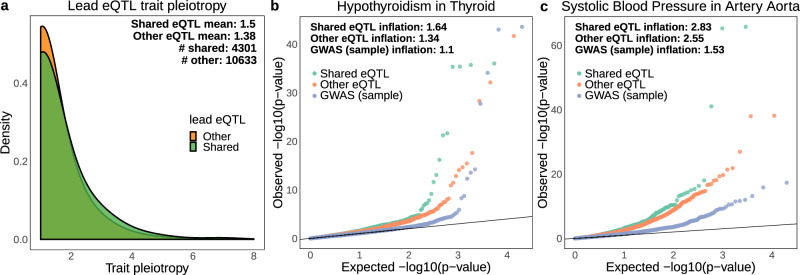
Fig. 5. Comparison of trait pleiotropy and association p-values between shared and other lead eQTLs.
a Distribution of trait pleiotropy (association p-value < 5e−8) across 35 UKBB GWAS traits. If a lead eQTL is shared in at least one tissue (even if not in other tissues) it is considered as “shared”. The remaining lead eQTLs compose the “other” category. Only lead eQTLs associated with at least one trait were considered; b, c Q–Q plots of association p-values (−log10 scale) for known tissue-trait matched pairs (hypothyroidism in thyroid tissue and systolic blood pressure in artery aorta), comparing shared (green) and other (orange) lead eQTLs. GWAS (blue) is a sample of 10,000 variants (randomly and independently picked for each trait) shown only for comparison purposes.

