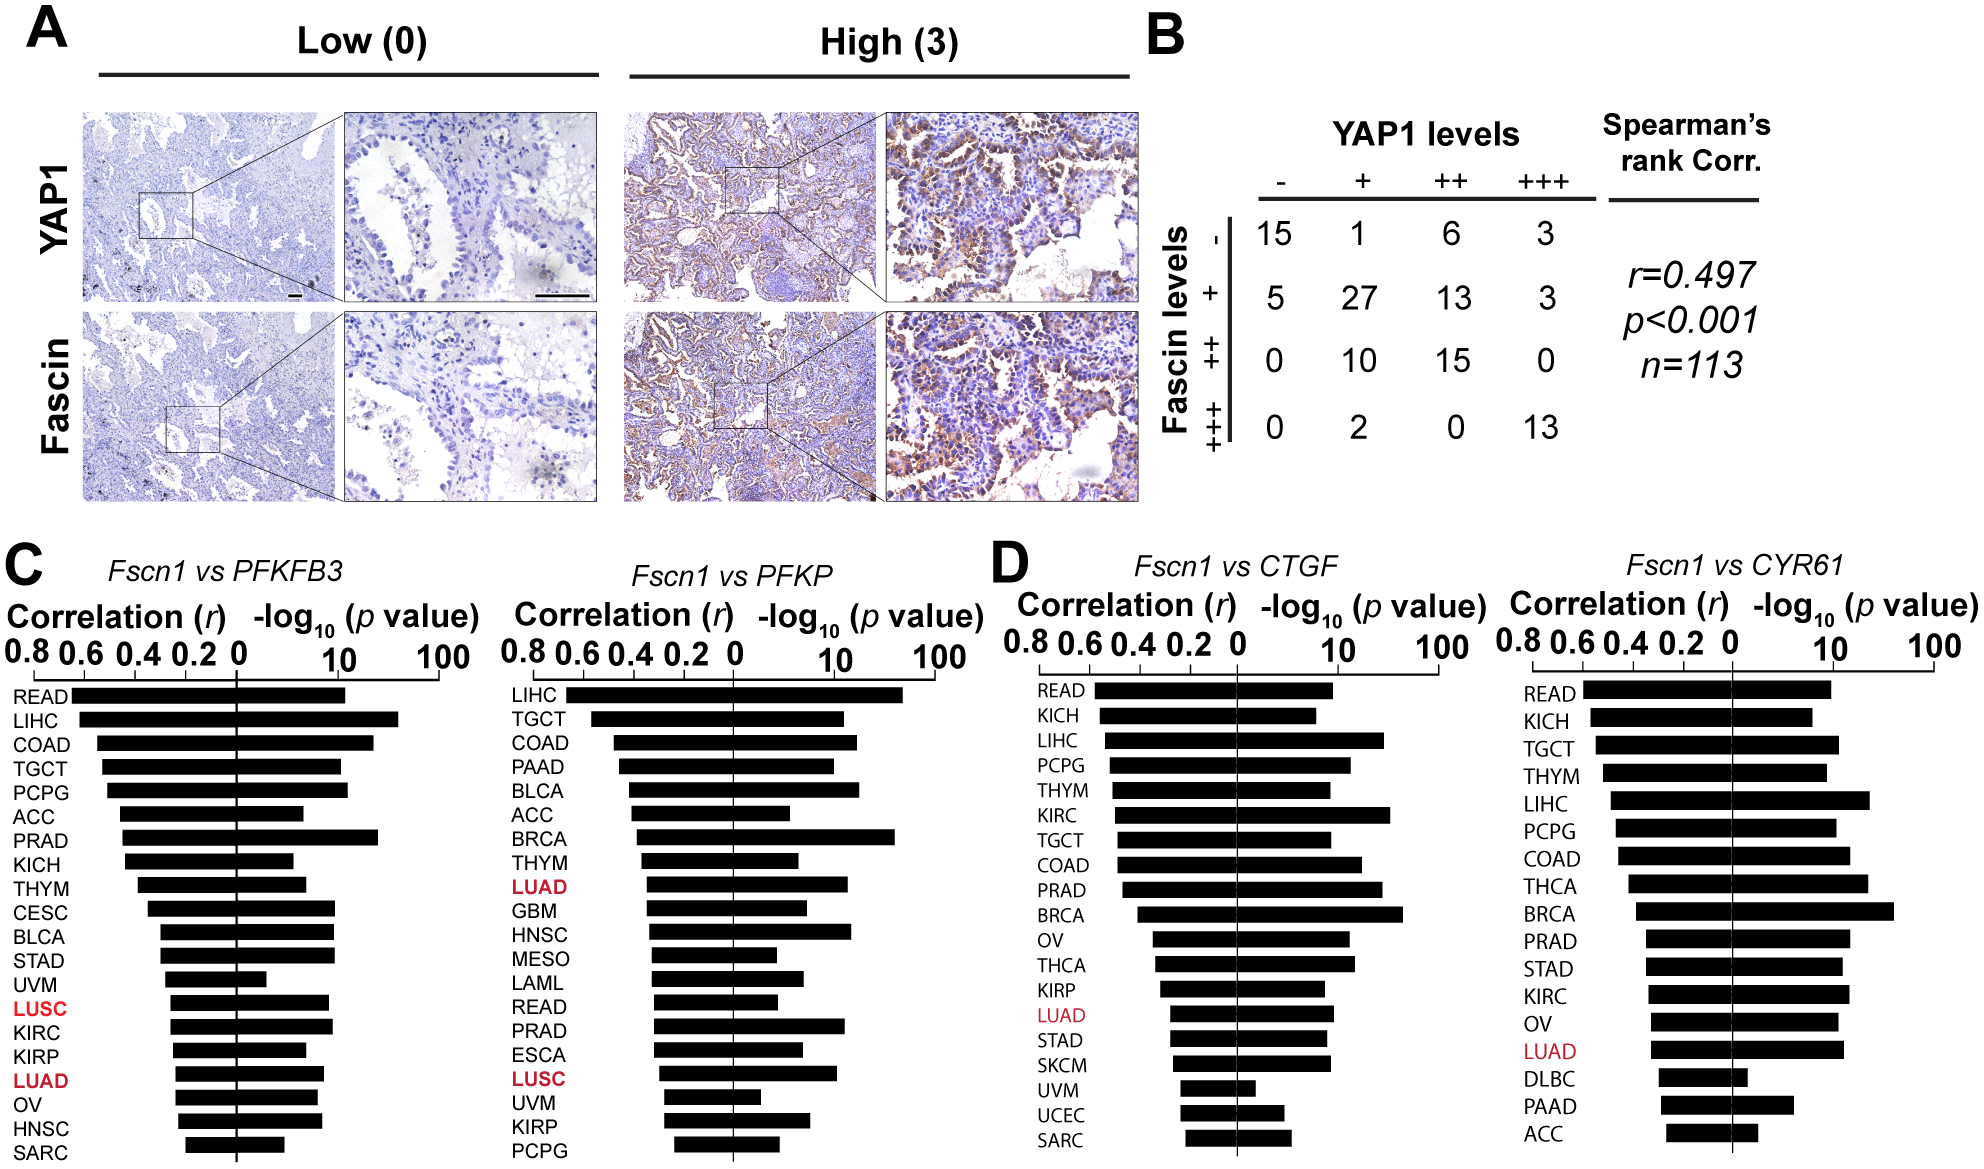
Figure 5. Fascin expression correlates with PFKs and YAP1 target genes in cancer patients.

A, representative immunohistochemistry staining images showing expression levels of YAP1 and fascin in lung adenocarcinoma patients.
B, correlation between fascin and YAP1 staining intensities in a cohort of 113 lung adenocarcinoma patient.
C, waterfall plot showing the correlation between fascin and PFKFB3 or PFKP in different cancers from the TCGA RNA sequencing database.
D, waterfall plot showing the correlation of fascin and YAP1 target genes (CTGF and CYR61) in different cancers from the TCGA RNA sequencing database.
Correlation coefficient (r) and p value in B–D were determined using Spearman’s rank test.
