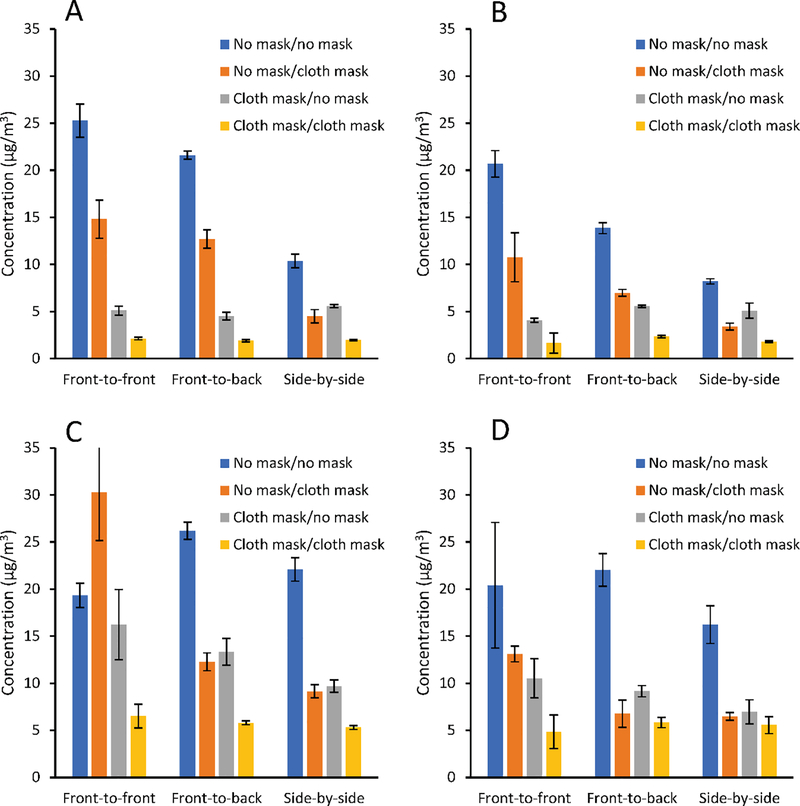
Figure 4.
Mean aerosol concentration over 15 min measured at the mouth of the recipient simulator with and without masks and with simulators in different orientations. (A) Source is coughing, simulators are 0.9 m (36”) apart. (B) Source is coughing, simulators are 1.8 m (72”) apart. (C) Source is breathing, simulators are 0.9 m apart. (D) Source is breathing, simulators are 1.8 m apart. Each bar is the mean of three experiments. Error bars show the standard deviation.

