
Figure 6.
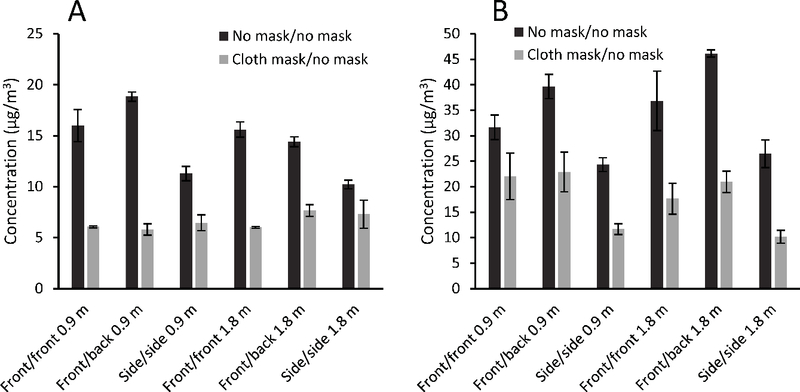
Aerosol concentration in the environmental chamber with and without a mask on the source simulator during (A) coughing experiments and (B) breathing experiments. The recipient simulator was unmasked during these experiments. The simulators were 0.9 or 1.8 m apart and oriented front-to-front, front-to-back, or side-by-side. For each experiment, the 15-min mean concentrations at five locations (excluding the location at the mouth of the recipient) were averaged to determine the chamber concentration. Each bar shows the average and standard deviation of the chamber concentrations from three experiments. Note that the source simulator expels a larger mass of aerosol during breathing experiments than during coughing experiments.