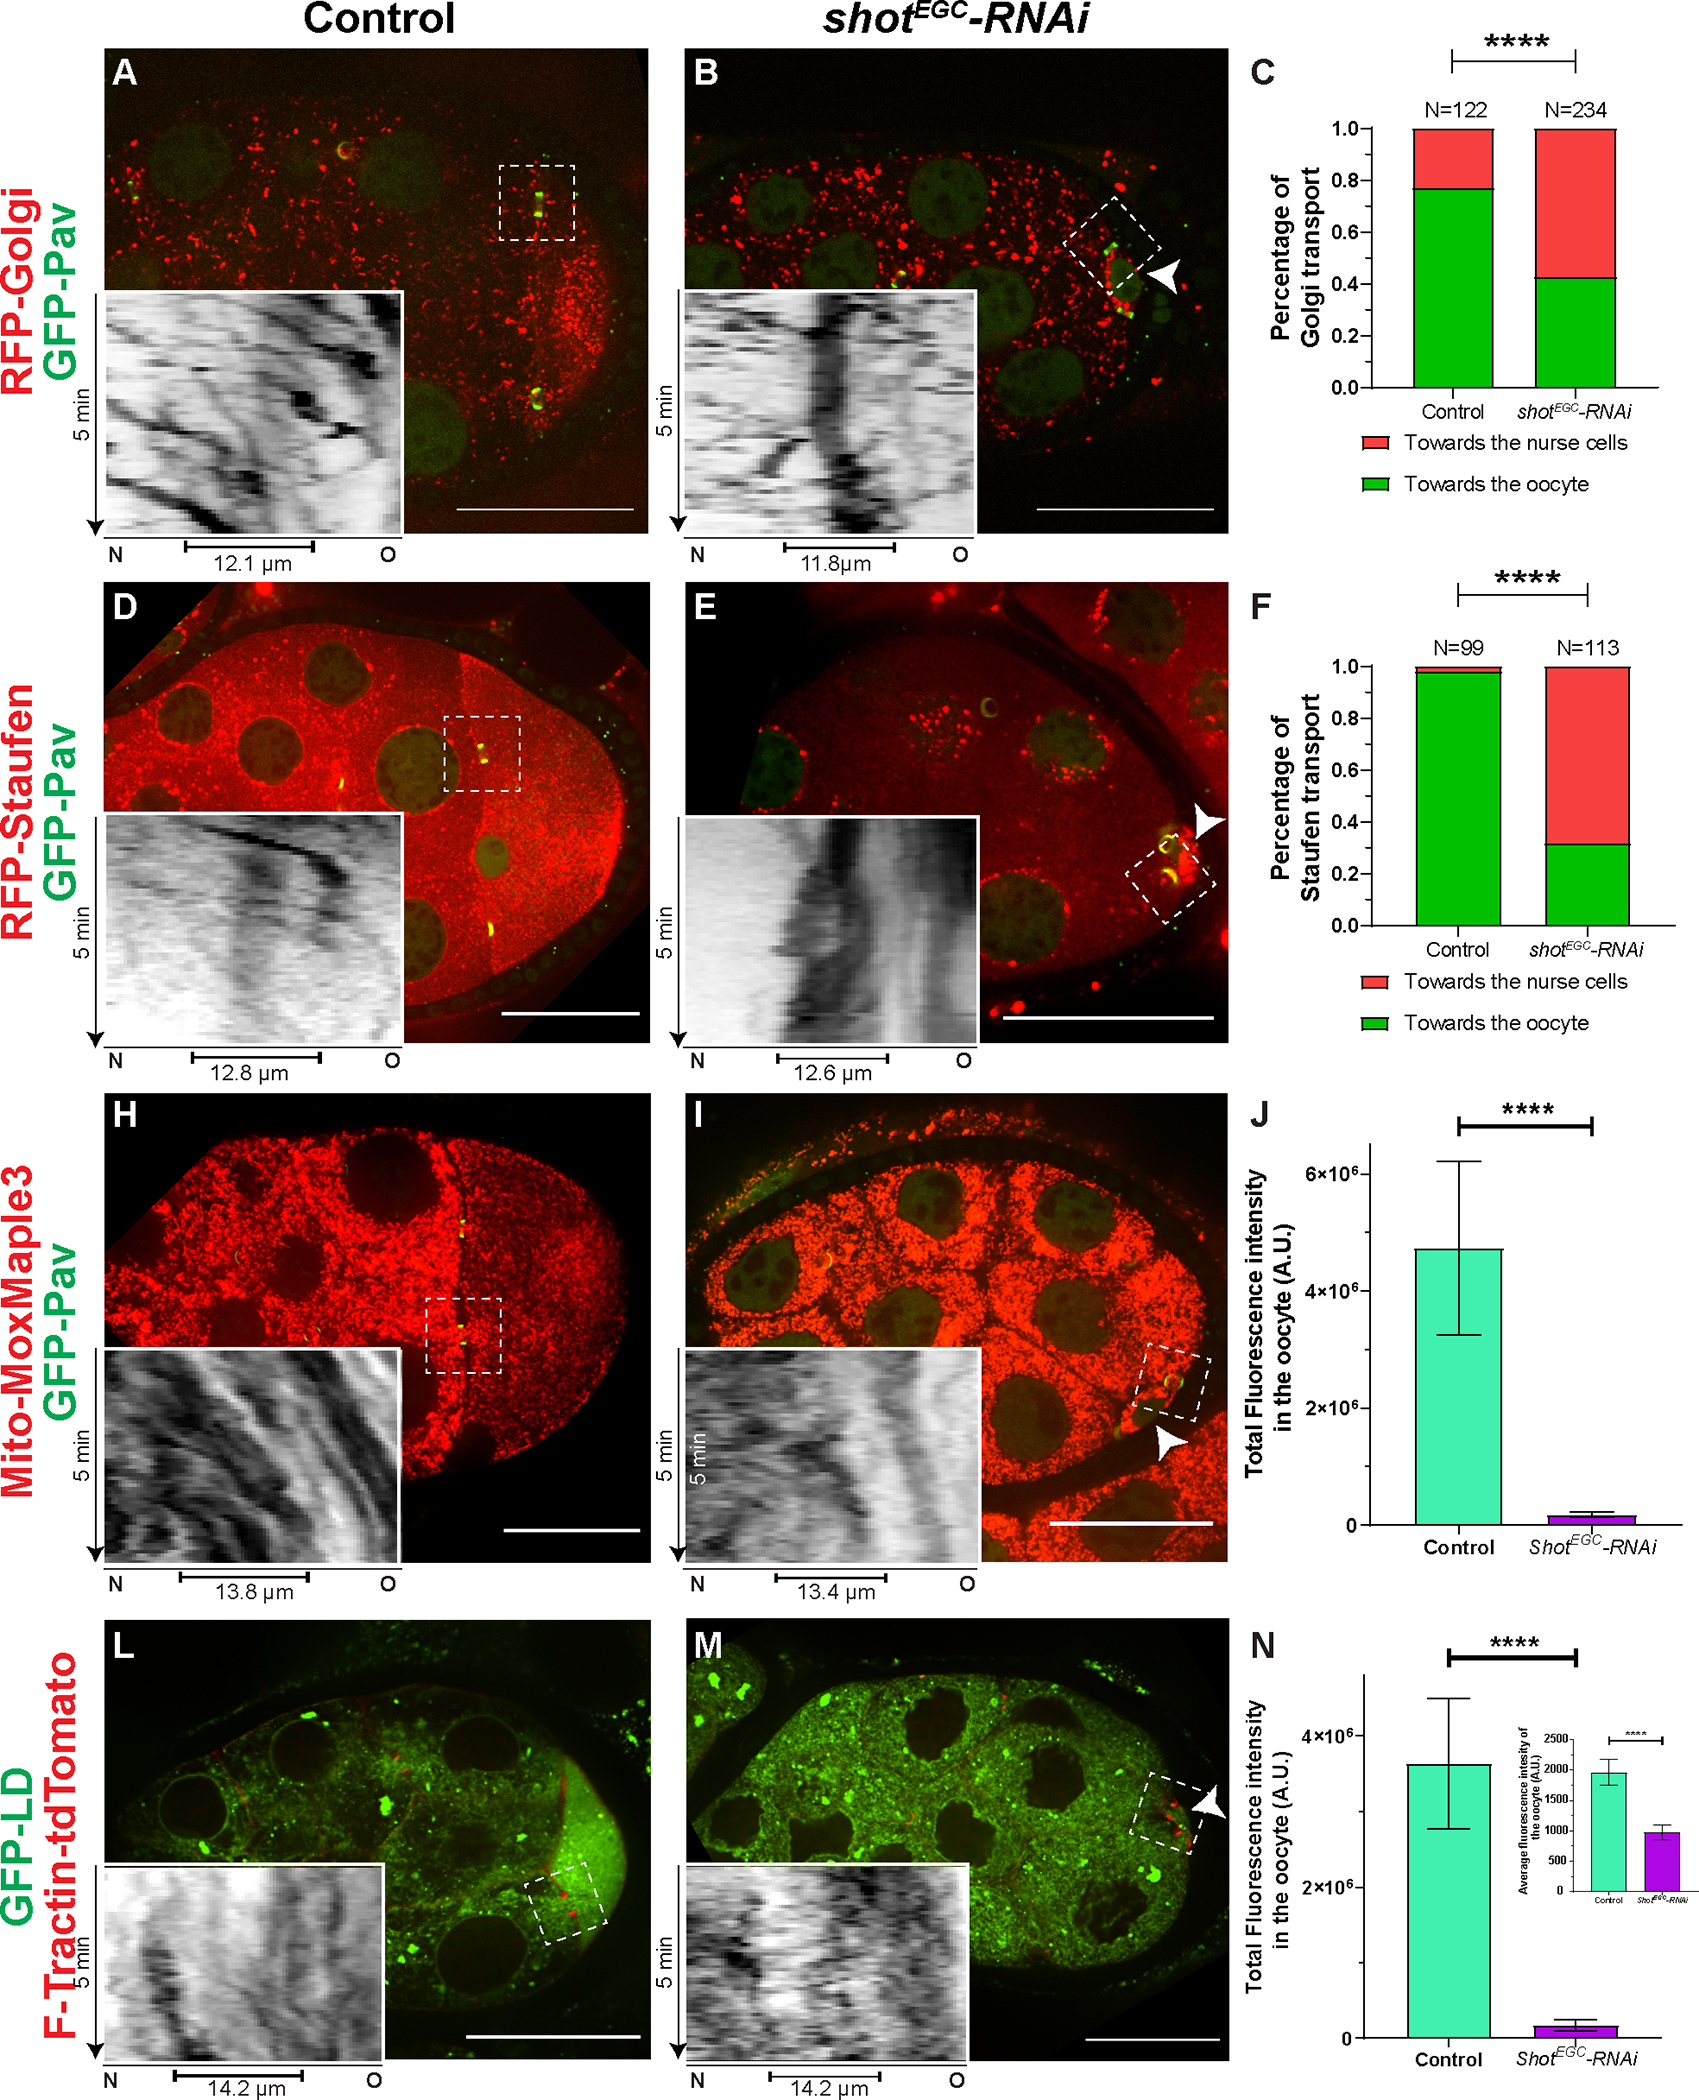
Figure 3. Shot controls directionality of cargo transport from the nurse cells to the oocyte.

(A-C) Golgi transport in the nurse cell-oocyte ring canals in control (A) and in shot-RNAi (B). Golgi are labeled with RFP-tagged human galactosyltransferase (GalT) (RFP-Golgi). (C) Quantification of Golgi transport directions in control and in shot-RNAi. Chi-square test between control and shot-RNAi, p-value < 0.00001 (****).
(D-F) Staufen RNP transport in the nurse cell-oocyte ring canals in control (D) and in shot-RNAi (E). Staufen RPNs are labeled with RFP-tagged Staufen (RFP-Staufen). (F) Quantification of Staufen transport directions in control and in shot-RNAi. Chi-square test between control and shot-RNAi, p-value < 0.00001 (****).
(H-J) Mitochondria transport in the nurse cell-oocyte ring canals in control (H) and in shot-RNAi (I). Mitochondria are labeled with Mito-MoxMaple3 (red channel, after global photoconversion). (J) Quantification of total mitochondria fluorescence intensity (mean ± 95% confidence interval) in control (N=18) and in shot-RNAi (N=22) oocytes. Unpaired t test with Welch’s correction between control and shot-RNAi, p-value < 0.0001 (****).
(L-N) Transport of lipid droplets in the nurse cell-oocyte ring canals in control (L) and in shot-RNAi (M). Lipid droplets are labeled with GFP-tagged lipid droplet domain of Drosophila protein Klar (GFP-LD). (N) Quantification of lipid droplet total fluorescence intensity and average fluorescence intensity (inset) (mean ± 95% confidence interval) in control (N=33) and in shot-RNAi (N=28) oocytes. Unpaired t test with Welch’s correction of total fluorescence intensity of GFP-LD between control and shot-RNAi, p-value < 0.0001 (****); Unpaired t test with Welch’s correction of average fluorescence intensity of GFP-LD between control and shot-RNAi, p-value < 0.0001 (****).
Left side: the nurse cells; right side, the oocyte; small oocytes in shot-RNAi are pointed with the white arrowheads; ring canals are labeled with either GFP-Pav (A-B, D-E, H-I) or F-Tractin-tdTomato (L-M); inverted kymographs were created along a ~3.7 μm-width line from the nurse cell (N, left side) to the oocyte (O, right side) through the ring canals (marked as capped lines underneath in the kymographs) in the white dashed box areas; scale bars, 50 μm.
