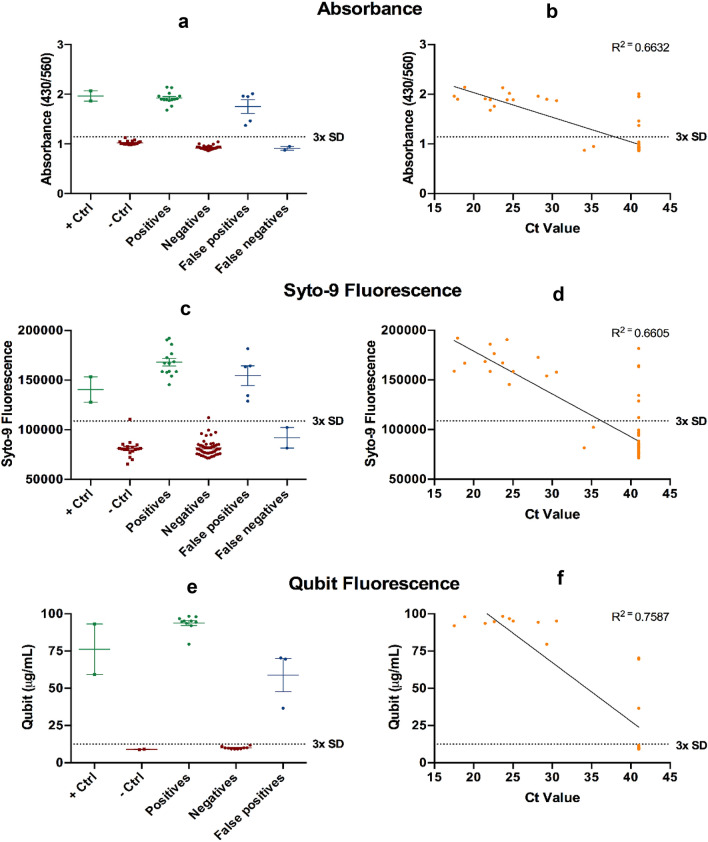
Figure 3.
Quantitative evaluation of pH-dependent colorimetric RT-LAMP readout. Three quantitative methods (a) Absorbance using 430/560 nm ratio; (b) SYTO 9 fluorescence using 485 nm (excitation) and 500 nm (emission); and (c) Qubit fluorescence using Qubit 2.0 fluorometer were used to assess the RT-LAMP result. (d–f) are the correlation analysis between RT-qPCR and the three quantitative evaluations, respectively. Each dot represents one experimental replicate. Dotted lines indicate 3× standard deviations above the negative controls.

