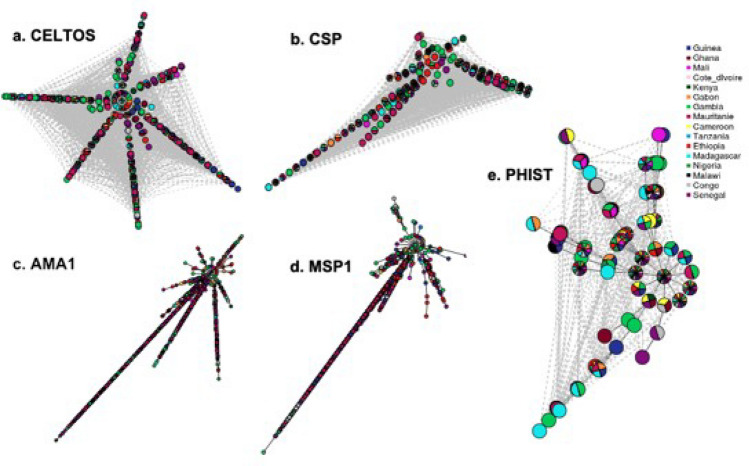
Figure 3.
Representative haplotype cluster networks of pre-erythrocytic and erythrocytic vaccine candidates. Clustering of haplotypes across populations for pre-erythrocytic candidates (a) CELTOS, (b) CSP, and erythrocytic vaccine candidates (c) AMA1, (d) MSP1 and (e) PHISTB. Each node represents a haplotype with pies colour coded according to the proportion of haplotypes originating from a specific country. The lengths of edges connecting each pair of pies is proportion to the number of base pair substitutions separating the haplotypes.

