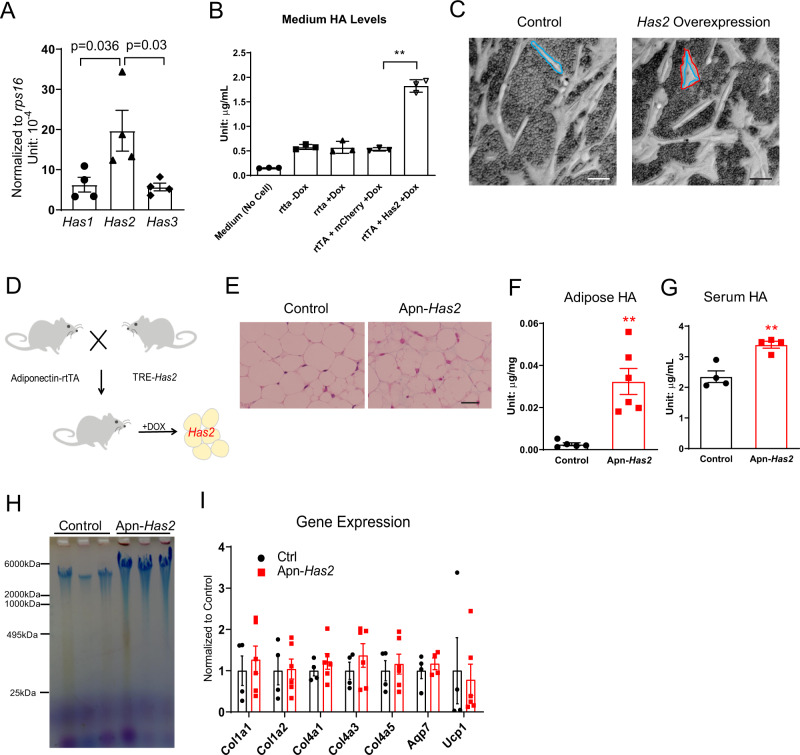
Fig. 3. Has2 overexpression increases HMW HA.
AHas1, Has2, and Has3 expression levels in the adipose tissue from 16-week-old C57BL/6J mice fed with normal chow diet (n = 4). One-way ANOVA followed by Tukey’s multiple comparisons test. B HEK293 cells overexpressing Has2 increase medium HA levels (n = 3). Two-tailed t-test to compare rtTA + mCherry + Dox vs. rtTA + Has2 + Dox, p < 0.0001. C Representative picture showing Met1 cells overexpressing Has2 have increased extracellular space revealed by adding mouse red blood cells into the culture before the microscopic imaging. Blue line indicates the cell’s body, red line indicates the boundary of cell’s extracellular matrix. The space between two lines is the extracellular matrix. Scale bar = 50 µm. D Schematic of mouse cross to generate adipose tissue-specific doxycycline-inducible Has2 overexpressing mice (Apn-Has2). E Representative pictures of inguinal adipose tissue slides stained with Alcian blue (Scale Bar = 50 µm). Mice were treated with Dox600 chow diet for 5 days. F Tissue HA concentration after adipose tissue Has2 overexpression induced by Dox600 chow diet treatment for 5 days (n = 5 for control, n = 6 for Apn-Has2 transgenic mice). Two-tailed t-test, p = 0.0019. G Serum HA concentration after adipose tissue Has2 overexpression induced by Dox600 chow diet treatment for 5 days (n = 4). Two-tailed t-test, p = 0.0032. H Electrophoresis of HA extracted from control and Apn-Has2 mice treated by Dox600 chow diet for 5 days, demonstrating Has2 overexpression mainly increases very high molecular weight HA. I Gene expression in adipose tissue overexpressing Has2 after 5 days of Dox600 chow diet treatment (n = 4 for control, n = 6 for Apn-Has2 mice). Two samples were not detected for Aqp7 gene. Two-tailed t-test for each gene. All data are presented as mean ± s.e.m. **indicates p ≤ 0.01.

