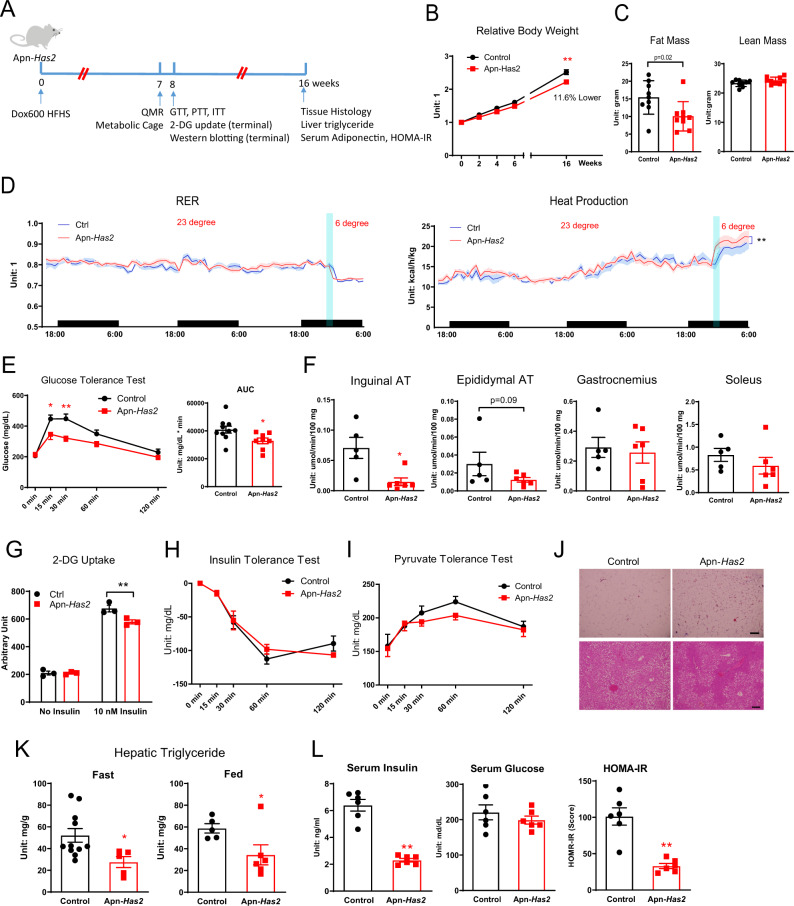
Fig. 4. Adipose tissue Has2 overexpression improves glucose tolerance on HFHS.
A Schematic representation of Apn-Has2 mouse treatment for panels B–L. Multiple cohorts of mice were used. B Relative body weights of Apn-Has2 animals on Dox600 HFHS diet (n = 9 mice per each genotype for period 0–6 weeks, n = 6 mice per each genotype for body weight measured at 16 weeks). Two-way ANOVA followed by Sidak’s multiple comparisons test, adjusted p-value > 0.9999, 0.6705, 0.2137, 0.1131, <0.0001 for 0, 2, 4, 6, 16 weeks, respectively. C Fat mass and lean mass of Apn-Has2 mice 7 weeks on Dox600 HFHS diet (n = 9 mice per each genotype). Two-tailed t-test. D RER and heat production of Apn-Has2 mice measured in metabolic cages. Cage temperature was reduced from 23 degree to 6 degree in the middle of the third night. Heat production in control and Apn-Has2 mice after temperature change was analyzed using two-way ANOVA. (n = 8 mice per each genotype). Two-way ANOVA test for time points after ramping to 6 °C (time points 66-75), p = 0.0008 for genotype factor, p = 0.0084 for time factor. E Glucose tolerance in Apn-Has2 mice. (n = 10 mice for control, n = 8 mice for Apn-Has2). Two-way ANOVA followed by Sidak’s multiple comparisons test, adjusted p-value = 0.9994, 0.0174, 0.0014, 0.2834, 0.8711 for 0, 15, 30, 60, and 120 min, respectively. AUC was analyzed by two-tailed t-test, p = 0.0252. F 2-DG uptake in inguinal, epididymal adipose tissues (AT), and gastrocnemius and soleus muscles. (n = 5 mice for control, n = 6 mice for Apn-Has2). Two-tailed t-test, p = 0.0099, 0.0899, 0.7387, 0.3488, for inguinal, epididymal adipose tissues (AT), and gastrocnemius and soleus muscles, respectively. G Insulin-stimulated 2-DG uptake in differentiated adipocytes derived from SVF isolated from apn-Has2 transgenic mice (n = 3 wells). Two-way ANOVA test, p < 0.0001 for treatment factor, p = 0.016 for genotype factor. Ctrl vs. Apn-Has2, p = 0.9995 (no insulin) and 0.0054 (10 nM insulin) for post-hoc Sidak’s multiple comparisons test. H Insulin tolerance in Apn-Has2 mice (n = 3 mice for control, n = 4 mice for Apn-Has2). Two-way ANOVA test. I Pyruvate tolerance in Apn-Has2 mice (n = 8 mice for control, n = 7 for Apn-Has2). Two-way ANOVA test. J Representative histology of inguinal adipose tissue (upper panels) and liver (lower panels) from Apn-Has2 mice after 16 weeks Dox600 HFHS diet treatment. Scale bar = 100 µm. K Quantification of liver triglyceride from Apn-Has2 mice under fast or fed conditions after 16 weeks Dox600 HFHS diet treatment. (Under fasting condition: n = 11 mice for control, n = 5 mice for Apn-Has2; under fed condition: n = 5 mice for control, n = 6 mice for Apn-Has2). Two-tailed t-test, p = 0.0286, and 0.0481 for fast and fed conditions, respectively. L Fasting insulin, fasting glucose, and HOMA-IR of Apn-Has2 mice after 16 weeks Dox600 HFHS diet treatment. (n = 6 mice per genotype). Two-tailed t-test, p < 0.0001, =0.3828, and 0.0003 for fasting serum insulin, fasting glucose, and HOMA-IR, respectively. All data are presented as mean ± s.e.m. *indicates p ≤ 0.05, **indicates p ≤ 0.01.

