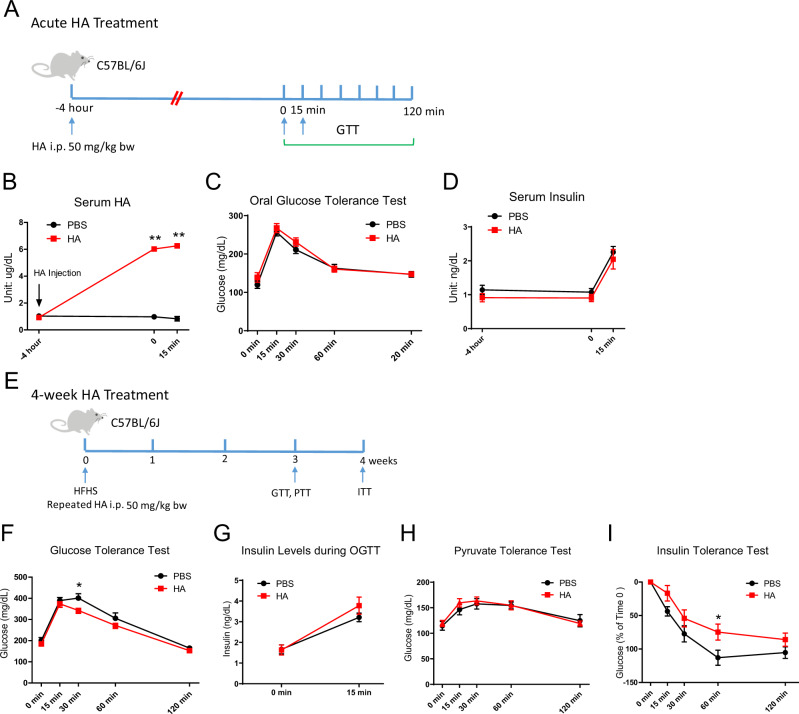
Fig. 5. Effects of HA i.p. injections on glucose metabolism.
A Schematic representation of mouse treatment for panels B–D. B Serum HA levels after an HA i.p. injection (n = 6 mice per group). Two-way ANOVA followed by Sidak’s multiple comparisons test, adjusted p-value = 0.8642, <0.0001, <0.0001 for -4 h, 0, and 15 min, respectively. C Oral glucose tolerance test 4 h after an HA i.p. injection (n = 12 mice per group). D Serum insulin levels assayed at times indicated by blue arrows in panel A (n = 12 mice per group). E Schematic representation of mouse treatment for panels F–I. Two cohorts of mice were used. F Repeated HA treatment effects on oral glucose tolerance (n = 8 mice per group). Two-way ANOVA followed by Sidak’s multiple comparisons test, adjusted p-value = 0.9546, 0.9700, 0.0467, 0.4970, 0.9873 for 0, 15, 30, 60, and 120 min, respectively. G Serum insulin levels after an oral glucose challenge (n = 4 mice for PBS, n = 6 mice for HA treatment). H Repeated HA treatment effects on pyruvate tolerance test (n = 8 mice for PBS, n = 9 mice for HA treatment). I Repeated HA treatment effects on insulin sensitivity. Glucose levels are plotted as the percentage of Time 0 (n = 8 mice). Two-way ANOVA followed by Sidak’s multiple comparisons test, adjusted p-value = 1, 0.2196, 0.3748, 0.0375, 0.6450 for 0, 15, 30, 60, and 120 min, respectively. All data are presented as mean ± s.e.m. *indicates p ≤ 0.05, **indicates p ≤ 0.01. Two-way ANOVA (C) (D) (G) (H).

