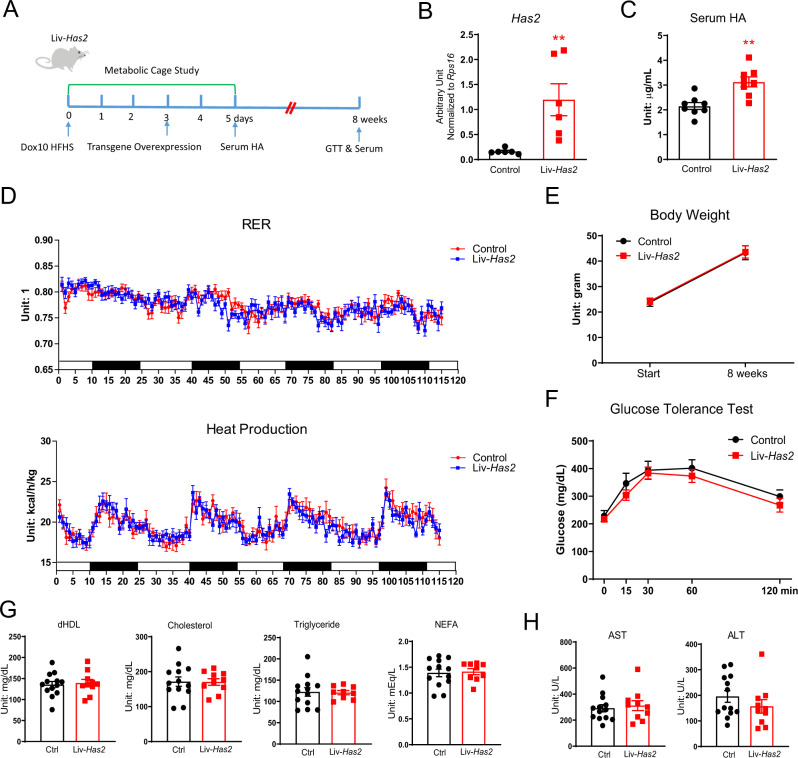
Fig. 6. Hepatic Has2 overexpression has no effect on glucose tolerance.
A Schematic representation of Liv-Has2 mouse treatment for panels B–H. Multiple cohorts of mice were used. B Has2 gene expression in Liv-Has2 livers on Dox10 HFHS diet for 3 days (n = 6 mice). Two-tailed t-test, p = 0.0013. C Serum HA for Liv-Has2 mice on Dox10 HFHS diet for 5 days (n = 8 mice). Two-tailed t-test, p = 0.009. D RER and calculated heat production in Liv-Has2 mice during 5-day of Dox10 HFHS diet feeding starting on the day 0 of metabolic cage study (n = 12 mice). E Body weight of Liv-Has2 mice before and after Dox10 HFHS diet for 8 weeks (n = 6 mice for control, n = 7 mice for Liv-Has2). F Glucose tolerance test of Liv-Has2 mice after 8 weeks of Dox10 HFHS treatment (n = 6 mice for control, n = 7 mice for Liv-Has2). G Serum lipids levels of Liv-Has2 mice after 8 weeks of Dox10 HFHS treatment (n = 13 mice for control, n = 10 mice for Liv-Has2). H Serum AST and ALT levels of Liv-Has2 mice after 8 weeks of Dox10 HFHS treatment. (n = 13 mice for control, n = 10 mice for Liv-Has2). All data are presented as mean ± s.e.m. **indicates p ≤ 0.01. Two-tailed t-test (G) (H); two-way ANOVA (D) (E) (F).

