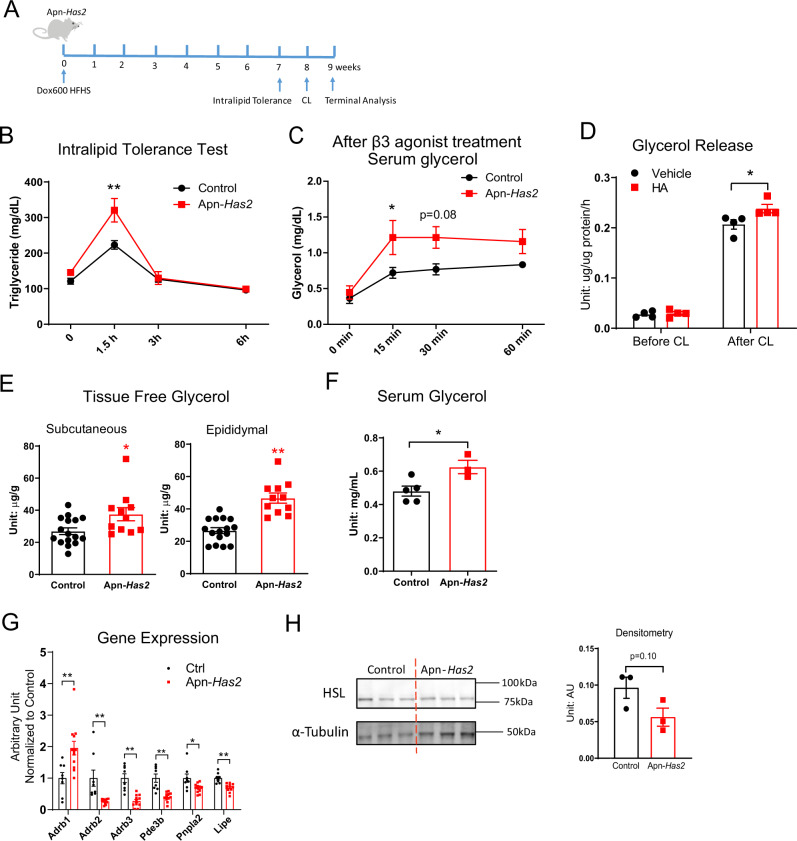
Fig. 7. Cellular Has2 overexpression primes cells for lipolysis.
A Schematic representation of Apn-Has2 mouse treatment for panels B–H. Multiple cohorts of mice were used; CL: CL 316,243. B Intralipid tolerance test for Apn-Has2 mice (n = 6 mice per genotype). Two-way ANOVA followed by Sidak’s multiple comparisons test, adjusted p-value = 0.7001, 0.0002, 0.9997, 1 for 0, 1.5, 3, and 6 h, respectively. C Glycerol release after β3 adrenergic receptor agonist CL 316,243 treatment (n = 5 mice per group). Two-way ANOVA followed by Sidak’s multiple comparisons test, adjusted p-value = 0.9869, 0.0439, 0.0813, 0.3049 for 0, 15, 30, and 60 min, respectively. D Glycerol release from in vitro differentiated adipocytes treated with HMW HA (10 µg/mL, 5 h) before and with CL 316,243 (1 µM) stimulation for 2 h (n = 4 mice per group). Two-way ANOVA followed by Sidak’s multiple comparisons test, adjusted p-value = 0.9749, 0.0125 for Vehicle vs. HA treatment before CL and after CL, respectively. E Tissue glycerol levels in Apn-Has2 mice (n = 16 mice for control, n = 11 mice for Apn-Has2). Two-tailed t-test, p = 0.0187, <0.0001 for Subcutaneous and Epididymal depot, respectively. F Serum glycerol of Apn-Has2 mice after overnight fasting (n = 5 mice for control, n = 3 mice for Apn-Has2). Two-tailed t-test, p = 0.0266. G Expression of lipolysis related genes in inguinal adipose tissue from mice treated with 5 days of Dox600 chow diet (n = 8 mice for control, n = 12 mice for Apn-Has2). Multiple two-tailed t-test, p = 0.0053, 0.0024, 0.00003, 0.00008, 0.014, 0.002 for Adrb1, Adrb2, Adrb3, Pde3b, Pnpla2, Lipe, respectively. H Western blot of HSL protein. Tissue lysates were prepared from the white adipose tissue dissected from mice treated with 9 weeks of Dox600 HFHS diet. HSL and Tubulin were blotted on two membranes in parallel. Densitometry result of HSL signal normalized to α-Tubulin is shown on the right (n = 3 mice per genotype). Two-tailed t-test, p = 0.10. All data are presented as mean ± s.e.m. *indicates p ≤ 0.05, **indicates p ≤ 0.01.

