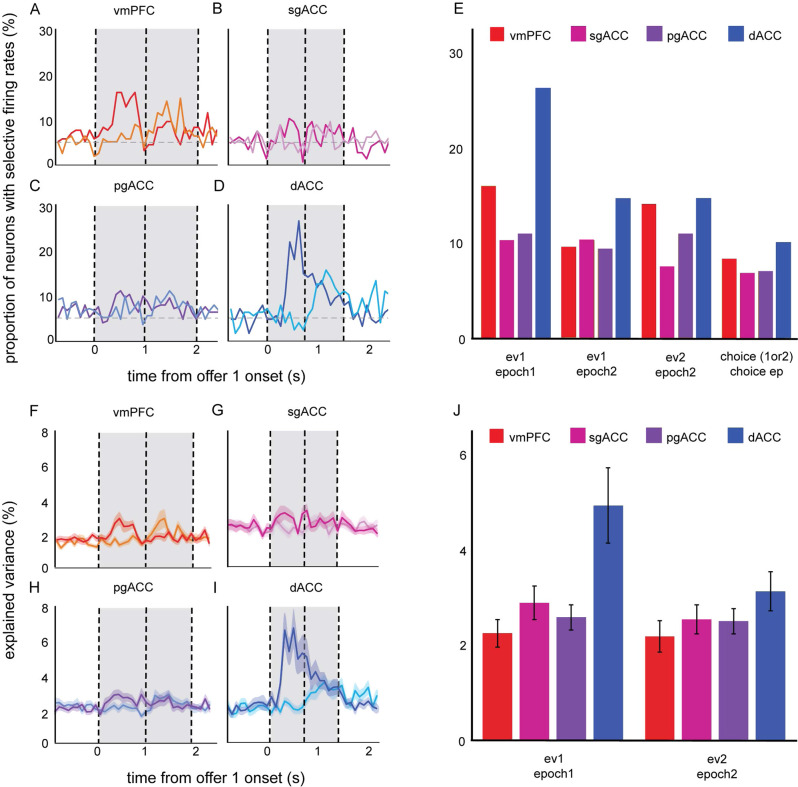
Fig. 3. Selectivity of firing rates to offers and choice.
A–D The proportion of neurons that have firing rates that are correlated with the expected value of offer 1 (darker color) and offer 2 (lighter color) across a 3-s period during the trial (red = vmPFC, pink = sgACC, purple = pgACC, blue = dACC). The onset of offer 1 is set to time 0. The vertical lines indicate the onsets of offer 1 and offer 2. Source data are provided as a Source Data file. E A summary of the proportion of neurons selective to offers and choice, within given epochs. Each bar indicates the proportion within a given brain area. Source data are provided as a Source Data file. F–I The average variance explained (r2) across neurons, from correlating firing rates with the expected values of offer 1 (darker color) and offer 2 (lighter color). Each trace (a measure of center) indicates the average explained variance across neurons. Vertical lines and shading on the x-axis indicate trial events. Error ribbons denote standard error. Source data are provided as a Source Data file. J A summary of average explained variance, collapsed across the respective offer epoch (500 ms window), relative to each of the offers (vmPFC: n = 156 neurons; sgACC: n = 146 neurons; pgACC: n = 213 neurons; dACC: n = 129 neurons). Error bars denote the standard error across neurons. Source data are provided as a Source Data file.

