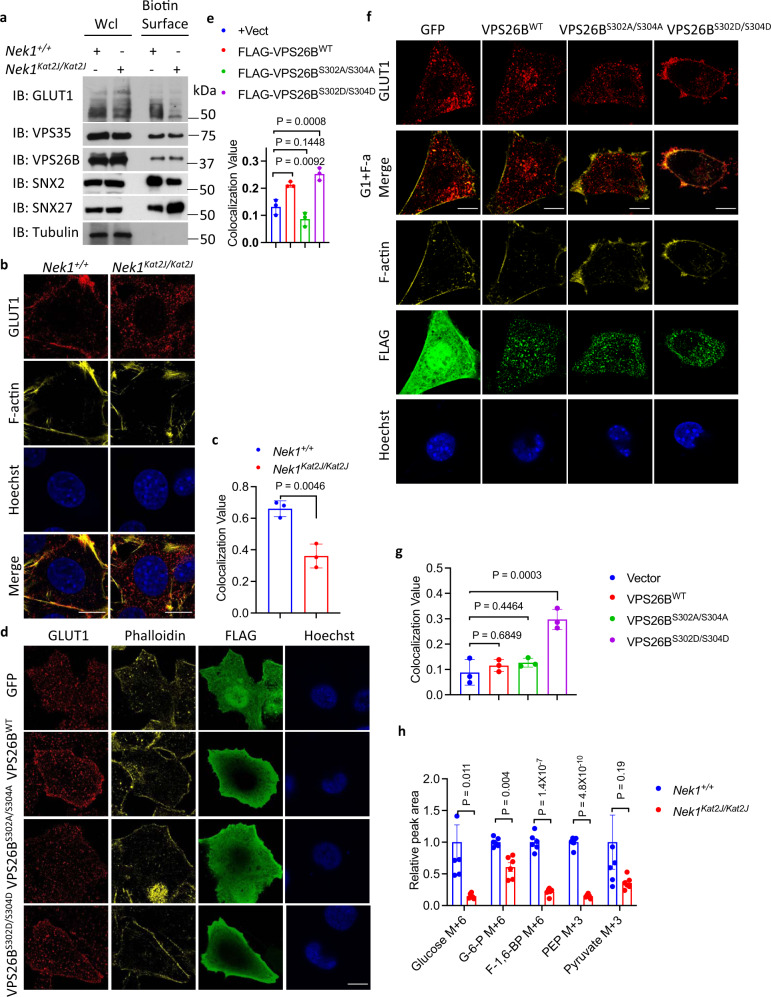
Fig. 5. NEK1 deficiency disrupts glucose uptake.
aNek1+/+ and Nek1Kat2J/Kat2J cells were treated with Sulfo-NHS-SS-Biotin to label cell-surface proteins in intact MEFs. The isolated plasma membrane proteins and whole cell lysates were analyzed by western blotting with indicated antibodies. Uncropped blots in the Source Data file. b, c Nek1+/+ and Nek1Kat2J/Kat2J MEFs were immunostained with anti-GLUT1 antibody and also with Phalloidin for F-actin. The cell surface presence of GLUT1 was quantified using CellProfiler. Bar = 20 µm. Mean ± SD, n = 3 biological independent experiments. Two-tailed Student’s t test (c). d, e HeLa cells were transfected with expression vectors for FLAG tagged VPS26BWT and VPS26BS302A/S304A for 24 h and immunostained with anti-GLUT1 antibody and Phalloidin. The cell surface presence of GLUT1 was quantified using CellProfiler, mean ± SD, n=3 biological independent experiments. Bar = 10 µm. One-way ANOVA with Dunnett’s test (e). f, g Nek1Kat2J/Kat2J MEFs were transfected with indicated expression vectors for 24 h and immunostained with anti-GLUT1 and Phalloidin. Bar = 20 µm. The cell surface presence of GLUT1 was quantified using CellProfiler (mean ± SD). n = 3 biological independent experiments. One-way ANOVA with Dunnett’s test (g). h Nek1+/+ and Nek1Kat2J/Kat2J MEFs were treated with 4 mM U-13C-glucose for 7 min and the cell lysates were analyzed by mass spectrometry for uptake and metabolism of glucose. The levels of 13C6 labeled glucose, Glucose-6-phosphate and fructose-1,6-bisphosphotate and metabolic products of 13C6 labeld glucose including 13C3 labeled phosphoenolpyruvate, pyruvate were quantified. Data are presented as mean ± SEM (n=6 biological independent repeats). Unpaired multiple t-test.

