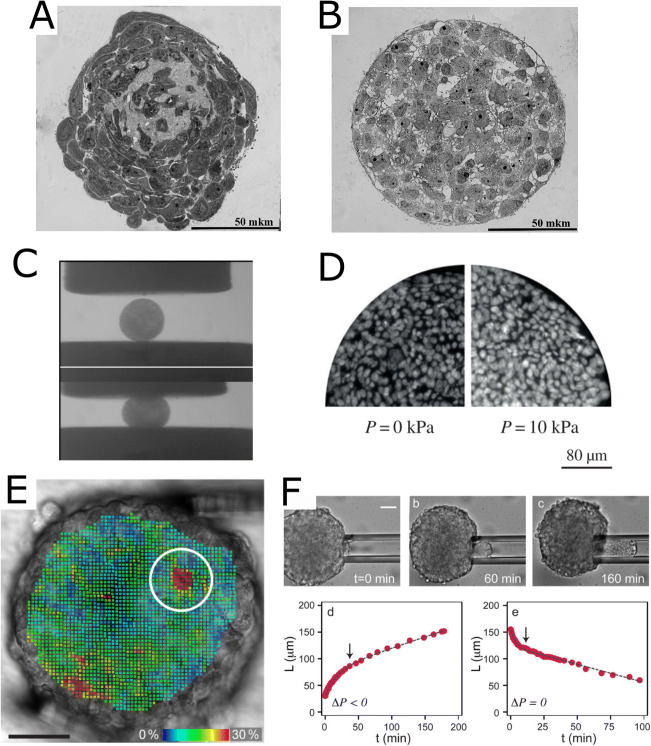
Fig. 4.
Structure and mechanical properties of cell spheroids. (A, B) Semi-fine sections, light microscopy of spheroids made of the limbal MSCs (A) and retinal pigment epithelium cells (B). Scale bars are 50 μm. Reprinted from (Kosheleva et al. 2020), CC BY-4.0, published by Springer Nature. (C) Snapshots of uncompressed (top) and compressed (bottom) embryonic chicken cardiac cushion tissue spheroids, parallel-plate compression setup. Reprinted from (Norotte et al. 2008) with permission from EPL, copyright 2008. (D) Cross-sections of spheroids from HT29 cells with DAPI-stained nuclei for zero (left) and 10 kPa (right) osmotic pressure applied using osmotic effect. Internuclear distances indicate that cell density increases mostly at the center of the spheroid under pressure. Reprinted from (Delarue et al. 2014) with permission from the Royal Society, copyright 2014. (E) Strain analysis made through 3D pattern tracking during compression with micromanipulators, Von Mises strains are color-coded. Spheroid from a breast tumor cell line BT474, encircled is the position of the soft single-cell-sized spot (Jaiswal et al. 2019). Scale bar is 50 μm. (F) Micropipette aspiration of spheroid made of murine sarcoma cell line S180. Bottom: aspiration and retraction cycles, L is an advancement of the spheroid inside the pipette, arrows indicate the transitions from elastic to viscous regimes. Scale bar is 50 μm. Reprinted with permission from (Guevorkian et al. 2010), copyright 2010 by the American Physical Society

