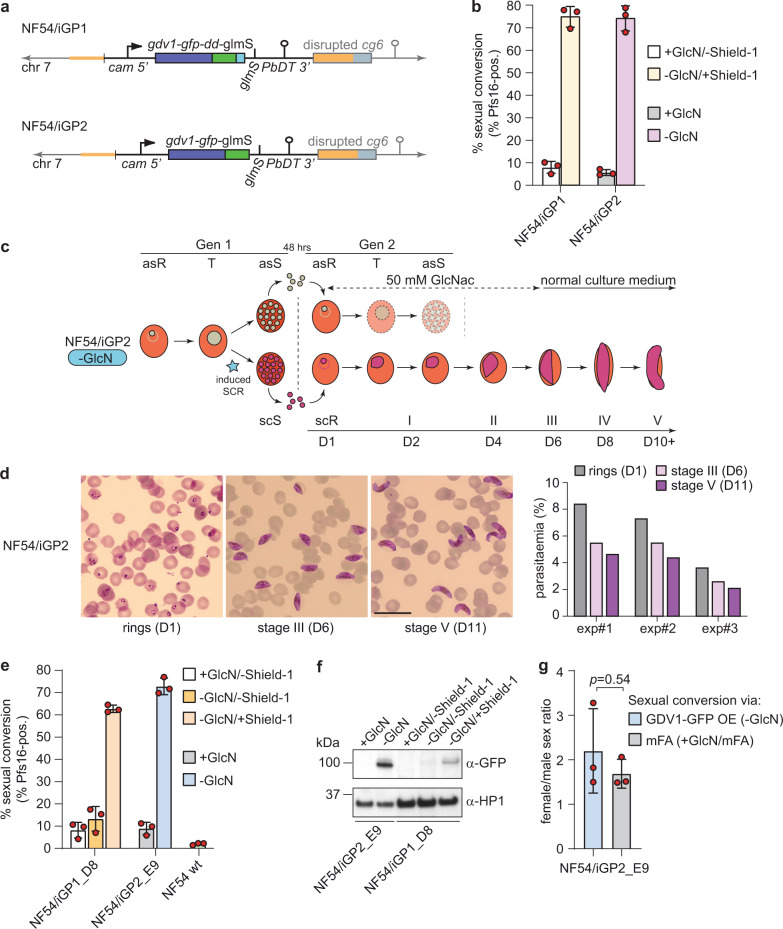
Fig. 2. Description of the inducible gametocyte producer lines NF54/iGP1 and NF54/iGP2.
a Schematics of the disrupted cg6 locus carrying a single inducible GDV1-GFP-DD-glmS or GDV1-GFP-glmS expression cassette in NF54/iGP1 or NF54/iGP2, respectively. The 5′ and 3′ homology regions used for CRISPR/Cas9-based transgene insertion are shown in orange. b Proportion of Pfs16-positive iRBCs (SCRs) in the progeny of NF54/iGP1 and NF54/iGP2 cultured under noninducing or inducing conditions (mean ± SD, n = three biologically independent experiments). Closed circles represent data points for individual experiments (≥391 DAPI-positive cells counted per experiment). c Schematic of the in vitro culture protocol used to obtain pure NF54/iGP2 stage V gametocyte populations. GlcN is removed from the culture medium of synchronous ring stage parasites at 0–16 hpi to trigger expression of GDV1-GFP. After schizont rupture and merozoite invasion, gametocyte maturation proceeds for >10 days. Asexual parasites are depicted in grey, sexually committed parasites and gametocytes are depicted in purple. asS/scS, asexual/sexually committed schizont; asR/scR, asexual/sexually committed ring stage; T, trophozoite; I–V, gametocyte stages I–V; D1–D10, days 1–10 of gametocyte maturation. Gen 1/2, generation 1/2. d Images of Giemsa-stained NF54/iGP2 gametocyte cultures, acquired on day 1 (asexual/sexually committed ring stages), day 6 (stage III gametocytes), and day 11 (stage V gametocytes). Images are representative of three independent experiments. Scale bar, 20 µm. Parasitemias determined from three independent induction experiments are shown on the right (≥2068 RBCs counted per experiment). e Proportion of Pfs16-positive iRBCs (SCRs) in the progeny of NF54/iGP1_D8 and NF54/iGP2_E9 parasites cultured under noninducing or inducing conditions and of NF54 wt control parasites (mean ± SD, n = three biologically independent experiments). Closed circles represent data points for individual experiments (≥143 DAPI-positive cells counted per experiment). f Western blot showing expression of GDV1-GFP (MW=99.1 kDa) and GDV1-GFP-DD (MW=111.3 kDa) in NF54/iGP2_E9 and NF54/iGP1_D8 schizonts (34–42 hpi), respectively. PfHP1 (MW = 31 kDa) served as a control to compare the relative numbers of nuclei loaded per lane. The results are representative of two independent experiments. g Sex ratios of NF54/iGP2_E9 stage V gametocytes obtained via GDV1-GFP overexpression (−GlcN) or via induction of sexual commitment using mFA medium (+GlcN/mFA), as quantified from α-Pfg377 IFAs (mean ± SD, n = three biologically independent experiments). Closed circles represent data points for individual experiments (≥192 gametocytes scored per experiment). Sex ratios were compared using a paired two-tailed Student’s t test (p value indicated above the graph).

