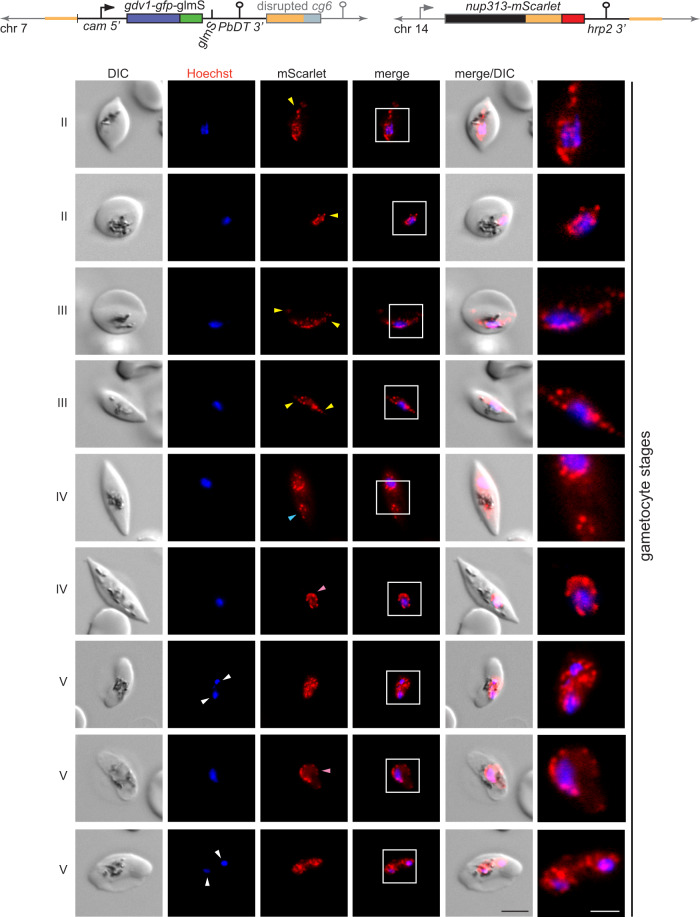
Fig. 5. Nuclei in stage II–V gametocytes undergo marked morphological transformations.
Schematic maps of the disrupted cg6 locus carrying a single inducible GDV1-GFP-glmS expression cassette and the tagged nup313 locus in double-transgenic NF54/iGP2_NUP313-mSc line are shown on top. The 5′ and 3′ homology regions used for CRISPR/Cas9-based genome editing are shown in orange. Live-cell fluorescence microscopy images showing the localisation of NUP313-mScarlet (red) in stage II to V gametocytes. Lateral extensions (yellow arrowheads) or rounded expansions (pink arrowheads) of the nucleus away from Hoechst-stained bulk chromatin and separate NUP313-mScarlet-delineated regions enclosing (white arrowheads) or devoid of Hoechst-stained bulk chromatin (blue arrowhead) are highlighted. II–V, stage II to V gametocytes. DIC, differential interference contrast. Nuclei were stained with Hoechst. Images are representative of four biologically independent experiments. Scale bar, 5 µm. White frames refer to the magnified view presented in the rightmost images (scale bar, 2 µm).

