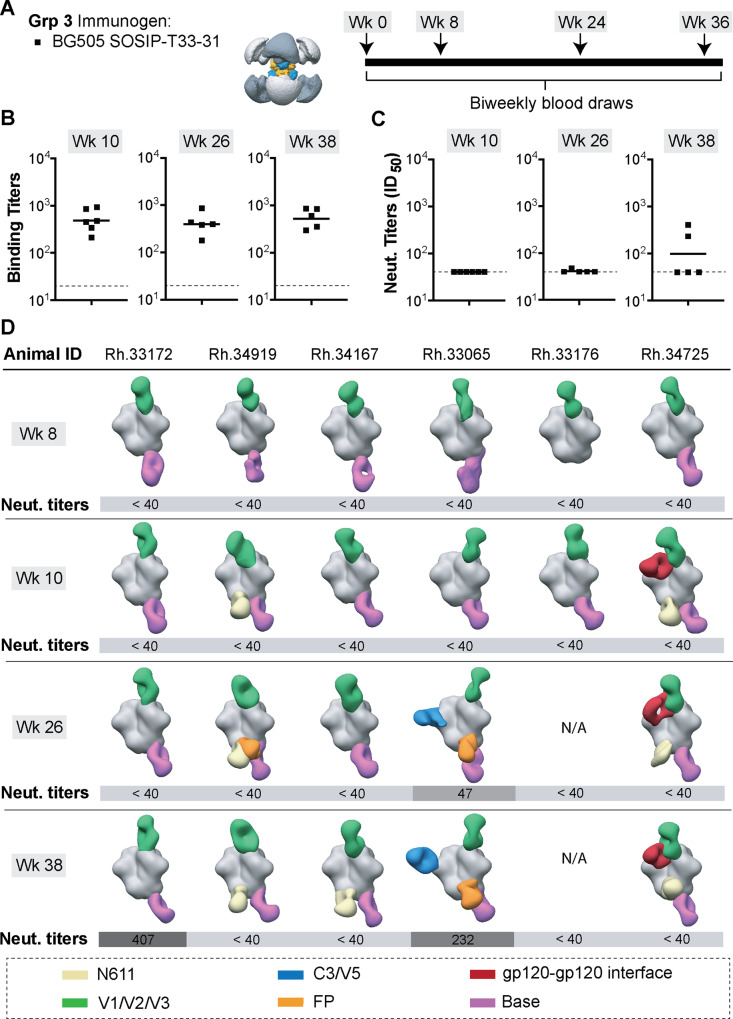
Fig. 6. Immunization experiments with the octameric BG505 SOSIP-T33-31 nanoparticle.
A Immunization information and schedule. B ELISA binding titers (midpoint) and C neutralizing antibody titers (ID50) for plasma samples collected at time points indicated above each graph. Horizontal lines represent the geometric mean values at each time point (n = 6 animals for week 10 and n = 5 animals for weeks 26 and 38; see Method section for details). ELISA and pseudovirus neutralization experiments were performed in triplicates (n = 3) for each serum sample at every time point and the mean value is plotted. C Composite figures from nsEMPEM analysis of polyclonal responses at weeks 8, 10, 26, and 38. Animal IDs are shown above each dataset. Neutralizing antibody titers for corresponding animals are shown below each composite figure. A color-coding scheme for antibodies targeting different epitope clusters is shown at the bottom. BG505 SOSIP antigen is represented in gray.

