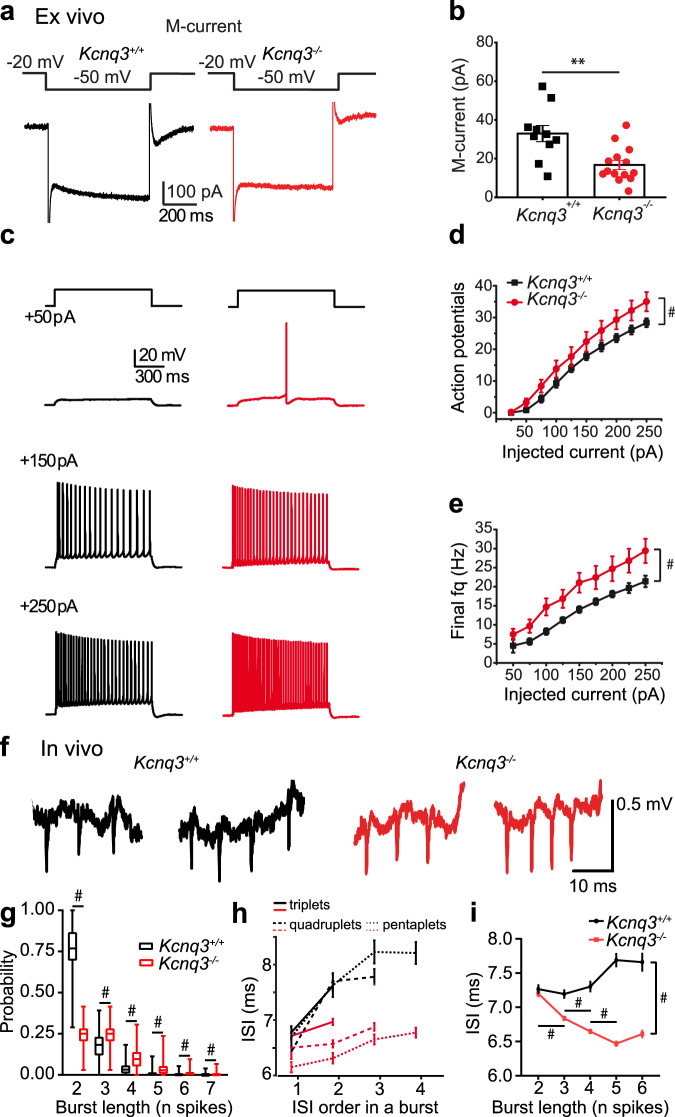
Fig. 1. Kcnq3-containing M-channels contribute to the excitability of pyramidal cells during burst discharge.
a Representative responses of CA1 pyramidal cells in hippocampal slices in voltage clamp experiments. b Amplitude of M-current measured as the slow deactivating tail current (n = 10 cells from 3 Kcnq3+/+ mice, black, n = 14 cells from 4 Kcnq3−/− mice, red, p = 0.002, t-test). The color code is used for the entire figure. c Representative responses of CA1 pyramidal cells in hippocampal slices to intracellular current injections of different magnitudes. d Number of action potentials (n = 11 cells from 4 Kcnq3+/+ mice, n = 12 cells from 4 Kcnq3−/− mice, F1,175 = 30.8, #, p < 0.0001, ANOVA) and (e) their frequency (calculated for the last two action potentials, n as in (d), F1,164 = 48.6, # p < 0.0001, ANOVA) upon injection of 1 s long currents of indicated amplitudes. f Extracellular signal traces recorded using a silicon probe in a behaving mouse, showing representative in vivo bursts consisting of 3 and 4 spikes. g Histograms of relative probability of bursts with different number of spikes (n = 299 cells from 6 Kcnq3+/+ mice; n = 413 cells from 4 Kcnq3−/− mice; #, p < 0.0001, Bonferroni tests). The center line indicates the median, the top and bottom edges indicate the 25th and 75th percentiles, respectively, and the whiskers extend to the maximum and minimum data points. h Spike frequency accommodation: ISI averaged according to their order in bursts containing different number of spikes (triplets, tetraplets and pentaplets). Accommodation rate was lower in Kcnq3−/− than in controls (n = 305 cells from 6 Kcnq3+/+ mice; n = 413 cells from 4 Kcnq3−/− mice; F1,44766 = 90.0; #, p < 0.0001, ANOVA). i Average ISI for bursts of different lengths was progressively shorter with increasing burst length in Kcnq3−/− but not in controls (burst length x genotype: n = same as in (h); F4,7604 = 18.8, p < 0.0001, ANOVA, #, p < 0.0001, Bonferroni tests; genotype: F1,7604 = 195.2, #, p < 0.0001). Data shown as mean ± SEM, see also Supplementary Information, Statistical Analysis (Fig. 1d,e, g-i).

