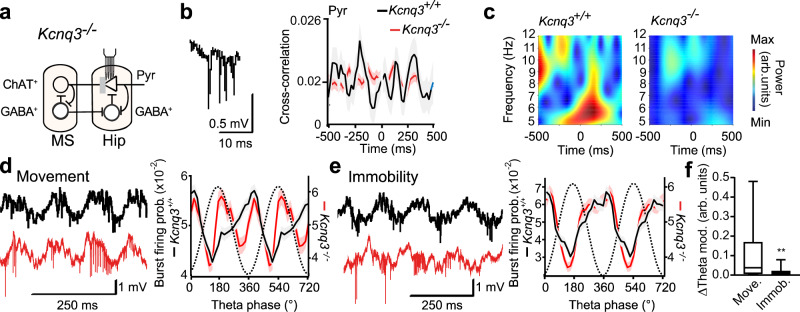
Fig. 2. Theta-rhythmic coordination of spike bursts during spatial navigation involves Kcnq3-containing M-channels.
a Scheme: impaired modulation (gray bar) of hippocampal (Hip) pyramidal cells (triangle, Pyr) via MS cholinergic neurons (circle, ChAT+) in Kcnq3−/− mice. Modulatory effects of cholinergic inputs are in part mediated by muscarinic receptor-mediated inhibition of Kcnq3-containing channels19. Circles, GABA+, inhibitory cells. b Example complex spike burst recorded in CA1 pyramidal layer (left) and cross-correlation of burst times between pyramidal cells (right) during theta oscillations (mostly during running, mean ± SEM (shaded bonds) of 154 cell pairs with joint firing of bursts out of 625 recorded pairs (25%) from 6 Kcnq3+/+ mice, black; 854 pairs with joint firing of bursts out of 1403 recorded pairs (61%) from 4 Kcnq3−/− mice, red; χ²(1, n = 2028) = 227.0, p<0.0001, χ²—test). The color code is used for the entire figure. c Spectrograms of average correlations between pairs of cells shown in (b), revealing theta-frequency coordination of bursts in Kcnq3+/+ (p = 0.007, permutation test) but not in Kcnq3−/− (p = 0.239) mice. d, e Burst probability as a function of theta oscillation phase during spatial navigation (d, n = 191 cells from 6 Kcnq3+/+ mice; n = 209 cells from 4 Kcnq3−/− mice) and alert immobility (e, Kcnq3+/+: n = 124 cells; Kcnq3−/−: n = 210 cells). Dotted line: reference oscillation cycle. Left: representative signals (1 Hz–10 kHz) showing theta oscillations and neuronal discharge during spatial navigation (d) and alert immobility (e) in Kcnq3+/+ and Kcnq3−/− mice. As typical for the mutant, a long burst in (d) starts close to the theta peak. Data are presented as mean ± SEM. f Difference of burst probability between genotypes during navigation (d, top) and alert immobility (e, top, independent squared differences for n = 20 phase bins/behavior, ** p = 0.0049, t test). The center line indicates the median, the top and bottom edges indicate the 25th and 75th percentiles, respectively, and the whiskers extend to the maximum and minimum data points. Arb. units, arbitrary units. See also Supplementary Information, Statistical Analysis (Fig. 2b–f).

