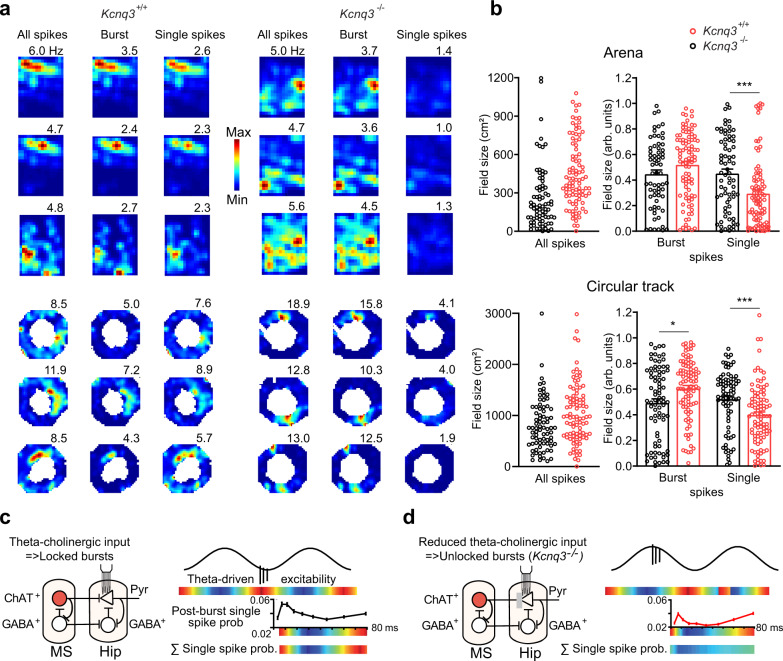
Fig. 3. Spatial representations by bursts and single spikes in Kcnq3−/− and wild-type mice.
a Firing maps of CA1 pyramidal cells recorded during navigation in a rectangular arena (top) or on a circular track (bottom). For each place cell, three firing maps were constructed: using all spikes (left), spikes fired in bursts (middle) and only single spikes (right). Peak rates (Hz) indicated above of each map, color scales match across burst and single-spike firing maps in each cell. b Size of place fields in the arena (n = 76 cells from 5 Kcnq3+/+ mice, black; n = 95 cells from 4 Kcnq3-/- mice, red, ***, p = 0.0004, Mann–Whitney-U-Test) and on the track (Kcnq3+/+: n = 78 cells; Kcnq3−/−: n = 94 cells *, p = 0.013, ****, p<0.0001). The color code is used for the entire figure. Schemes illustrating the impaired spatial firing of single spikes during intact (c, Kcnq3+/+) and impaired (d, Kcnq3−/−) entrainment of burst discharge. Inset curves show probability of a single spike emission as a function of silence duration after a burst (n = 117 cells from 6 Kcnq3+/+ mice; n = 167 cells from 4 Kcnq3−/− mice). Red circles, ChAT+ cells; GABA+, inhibitory cells; Pyr, pyramidal cells. The sine wave denotes theta oscillation cycle, arb. units, arbitrary units. Data are presented as mean ± SEM, see also Supplementary Information, Statistical Analysis (Fig. 3b–d).

