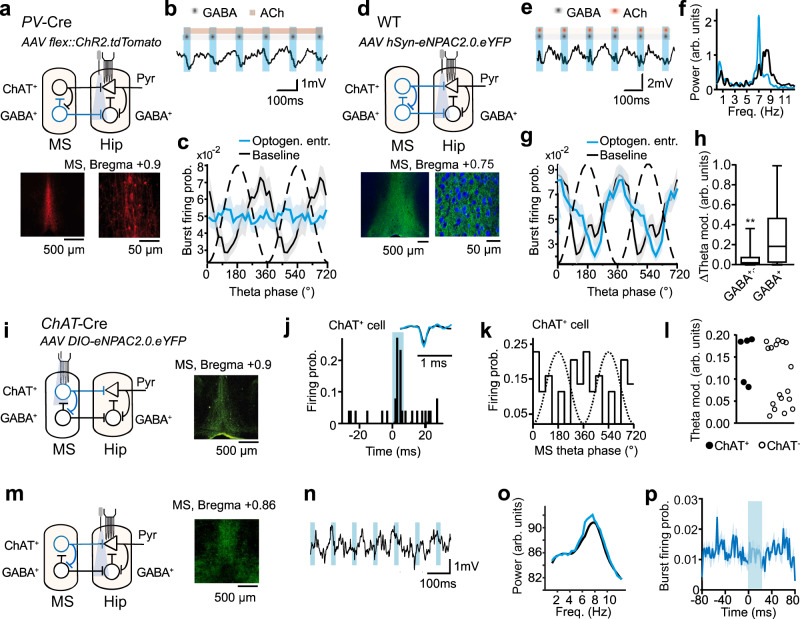
Fig. 4. Entrainment of pyramidal cell bursts in Kcnq3+/+ mice by collective rhythmicity of MS inputs.
a Scheme: optostimulation of MS GABAergic inputs (blue) to hippocampus and neuronal recordings. Images: ChR2-tdTomato expression. b Entrainment of theta oscillations in (a). Blue bars: light pulses; gray dots: projections of MS-GABA+-neurons; red line: not stimulated cholinergic inputs. c Stimulation of GABA+-inputs entrains oscillations but not pyramidal cells’ bursts (n = 14 and 18 cells, 3 mice). d Scheme: ChR2 stimulation of MS-GABA+ (gray dots) and GABA- (including cholinergic, red dots) inputs and neuronal recordings. Images: eNPAC2.0-eYFP expression (see also Supplementary Fig. 6a). e Entrainment of theta in (d). Dots: MS-GABA+ (gray) and GABA- (red) inputs. f LFP power spectra during 7 Hz stimulation (blue) and baseline (black). g Modulation of bursts during baseline and phase-locked activation of GABA+- & GABA--inputs (n = 37 and 38 cells, 3 mice, see also Supplementary Fig. 6d). h Bursts entrainment during stimulation of GABA+- (c) vs. GABA+- & GABA--projections (d) (independent squared differences with spontaneous theta in n = 20 phase bins/group, p = 0.0055, t test). i Scheme: optostimulation of cholinergic neurons and neuronal recordings in the MS. Image: eNPAC2.0-eYFP expression. j Light-triggered CCG of a putative MS-ChAT+-cell (response: 5.3 SD above mean). Inset: average spikes during baseline and stimulation (Pearson’s r = 0.97). k Firing probability of the cell from (j) vs. MS theta-phase. l High and low theta-rhythmic MS cells (pulled distribution’s bimodality: p = 0.005, Silverman’s test, n = 22 cells). ChAT+-cells rhythmicity: 55th/upper 20th and upper 10th percentiles in highly and low rhythmic populations, respectively. m Scheme: optostimulation of cholinergic projections and hippocampal recordings. Image: eNPAC2.0-eYFP expression. n Theta oscillations are not phase-synchronized to the stimulation of cholinergic projections. o CA1 LFP power spectra during baseline and stimulation of cholinergic projections. p Stimulation of cholinergic inputs alone does not influence burst firing of pyramidal cells (spike counts, baseline vs. light, p > 0.05, permutation test, n = 18 cells, 2 mice). Data in curves are presented as mean ± SEM (shaded bonds), arb.units, arbitrary units, see also Supplementary Information, Statistical Analysis (Fig. 4h, l).

