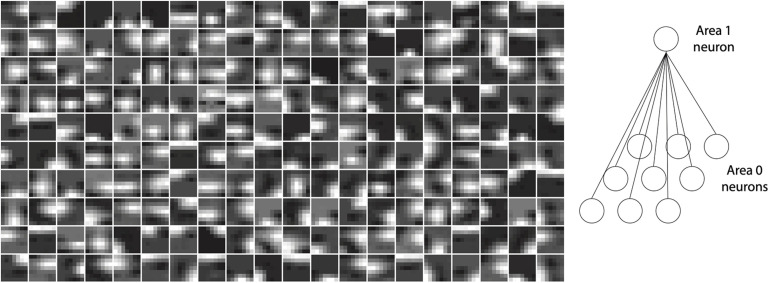
FIGURE 4.
Orientation selectivity emerges in the lowermost area (area 1) of a trained model with receptive fields. Plots show normalized synaptic strengths for connections between area 1 and 0 (i.e., the input layer) of the model. Each box shows a symbolic representation of synaptic strengths from a randomly selected area 1 neuron to all area 0 neurons within its receptive field (right panel). Darker regions in the images correspond to normalized synaptic strengths closer to 0 and brighter regions in the images correspond to normalized strengths closer to 1. It can be observed that receptive fields of many cells contain non-isotropic patches imposing orientation selectivity on neural responses in area 1.

