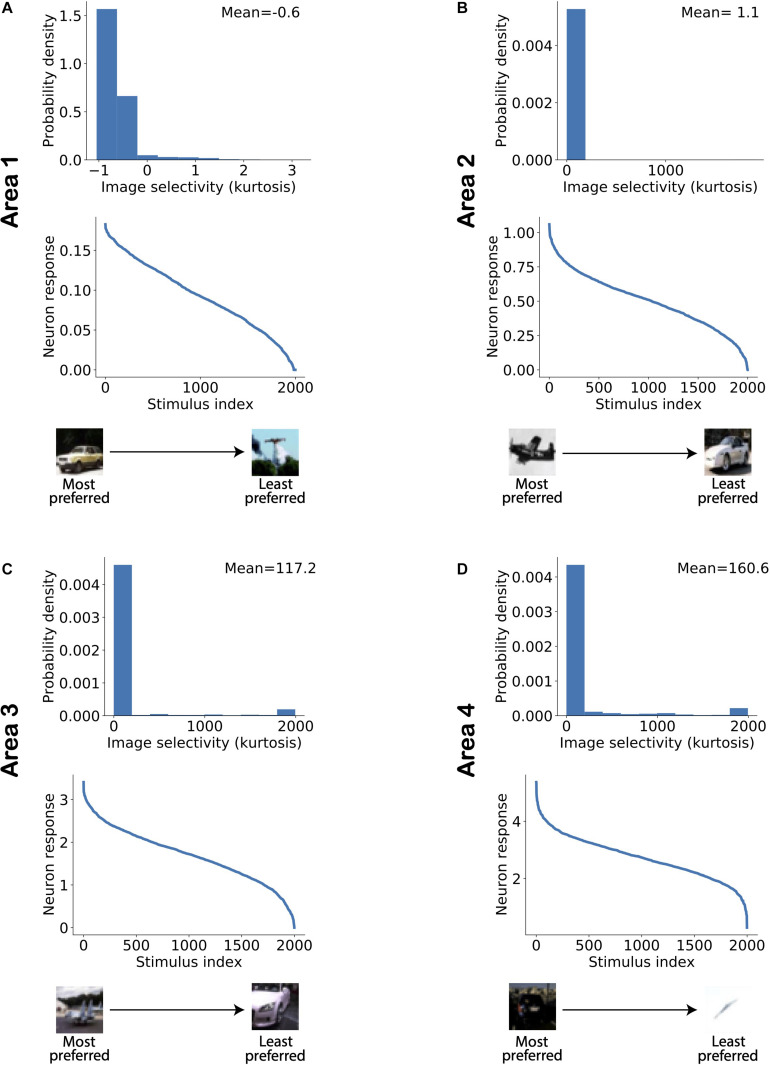
FIGURE 5.
Image selectivity of model neurons increases across ascending areas of the model. (A–D) Distribution of image selectivity of neurons in each area of the model (top panels; A: lowest area/Area 1; D: highest area/Area 4). The mean value of neuronal image selectivity for each area is shown in the top right corner of the corresponding plots. (Bottom panel) The activity of a randomly chosen neuron in each corresponding area has been sorted according to its response strength for all stimuli presented to the network. It can be observed that the average selectivity of neurons increases from lower to higher areas in line with experimental data.

