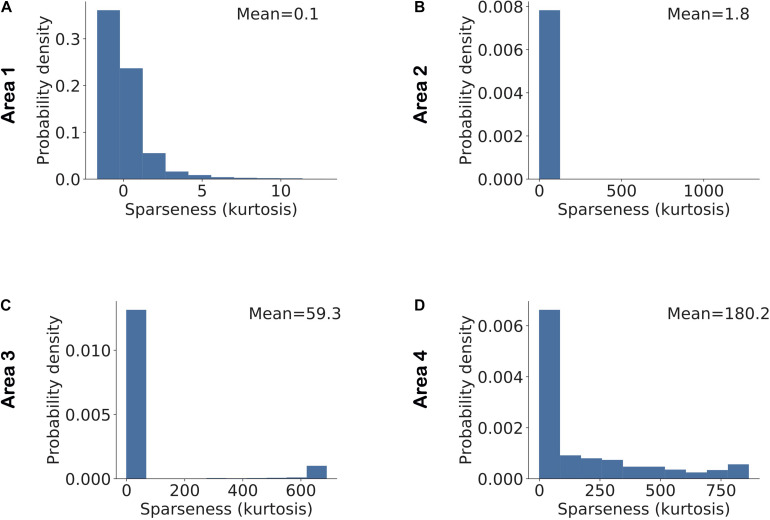
FIGURE 7.
Sparseness in neuronal activity increases across ascending areas of the model. Sparseness was measured as the kurtosis across all neuronal responses in a given area and given a single stimulus. The mean value of sparseness is computed by averaging these estimates of kurtosis across all stimuli. (A–D) Distribution of sparseness in each area. The mean value of sparseness for each area is shown in the top right corner of each plot. It can be noted that the average sparseness of all neurons in model areas increases from lower to higher areas in agreement with some of the experimental studies.

