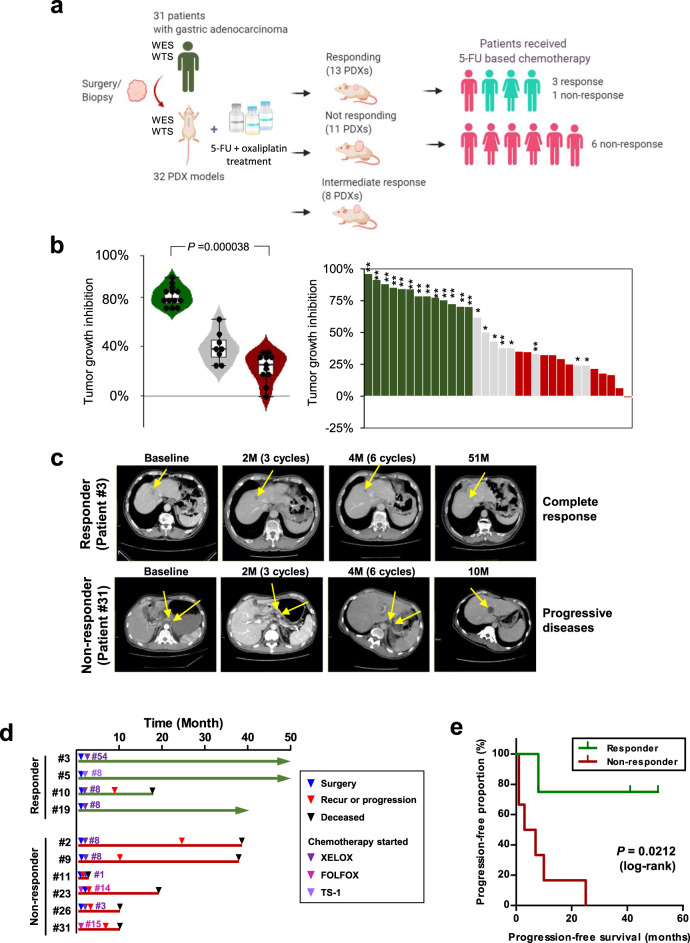
Fig. 1. Classification of gastric cancer (GC) PDX models, based on responsiveness to 5-FU-based chemotherapy, and similarities to patients’ clinical responses.
a Graphical overview of the study. This figure was generated using BioRender. WES whole-exome sequencing, WTS whole-transcriptome sequencing. b Percent tumor growth inhibition (TGI (%)) of 32 PDX models. Asterisks indicate significant differences between the responder and non-responder groups (*P < 0.05; **P < 0.0001). Violin plot shows the TGI values of PDX models of the responder (n = 13), non-responder (n = 11), and intermediate-responder (n = 8) groups. In the box and whisker plots, data are presented as median value and standard deviation, and the bottom and top edges of the box indicate the 25th and 75th percentiles, respectively. Two-tailed Mann–Whitney U test using normal distribution (P = 0.000038) was performed. c Computed tomographic images of two representative patients with clinical responses that were consistent with their respective PDX responses. Cycles of chemotherapy are indicated in the bracket. The yellow arrow indicates tumor mass. M months. d Clinical outcome of patients treated with 5-FU-based chemotherapy. Of four patients whose PDX models were classified as responders, three patients (patient #3, #5, and #19) showed prolonged survival, without recurrence or progression to XELOX and TS-1 treatment. All of the six patients whose PDX models were classified as non-responders showed tumor progression and poor prognosis. XELOX capecitabine (prodrug of 5-FU) and oxaliplatin, FOLFOX folinic acid, 5-FU, and oxaliplatin, TS-1 a combination of tegafur, gimeracil, and oteracil potassium. TS-1 is converted into 5-FU after absorption. The number of treatment cycles is indicated after the drug names. e Progression-free survival of patients, based on the responses of their respective PDX models. Two-sided log-rank test (P = 0.0212).

