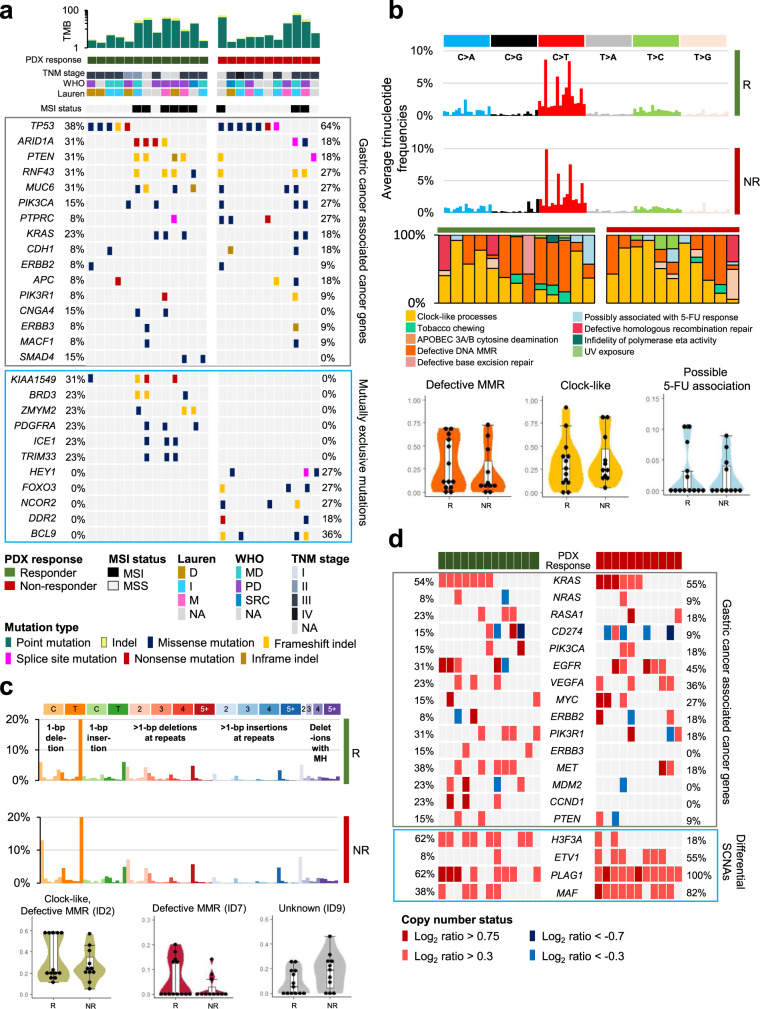
Fig. 2. Comprehensive genomic profiles associated with responsiveness to 5-FU and oxaliplatin-based chemotherapy.
a Overall mutation patterns for both the responder (R) and non-responder (NR) groups. Tumor mutation burden (TMB) and clinicopathologic information (top), somatic mutation patterns of GC-associated genes (middle), and exclusively mutated cancer-associated genes (mutation frequency >20% only in the R or NR groups; bottom) were compared between the R and NR groups. b Trinucleotide mutation frequencies of the R and NR groups (top) and mutational signatures of single base substitutions (middle). Each mutational signature was grouped by the proposed etiology. Representative mutational signatures of 13 responders and 11 non-responders are shown with violin plots (bottom). In the box and whisker plots, data are presented as median value and standard deviation (SD), and the bottom and top edges of the box indicate the 25th and 75th percentiles, respectively. c Somatic indel frequencies of the R and NR groups (top) and differential mutational signatures of small insertions and deletions (bottom). In the box and whisker plots, indel signature proportions of 13 responders and 11 non-responders are presented as median value and SD, and the bottom and top edges of the box indicate the 25th and 75th percentiles, respectively. d Gene-level somatic copy number alterations in GC-associated genes (top) and differentially altered cancer-associated genes between the R and NR groups (bottom; Two-sided Fisher’s exact test P < 0.1. Data are provided in Source data).

