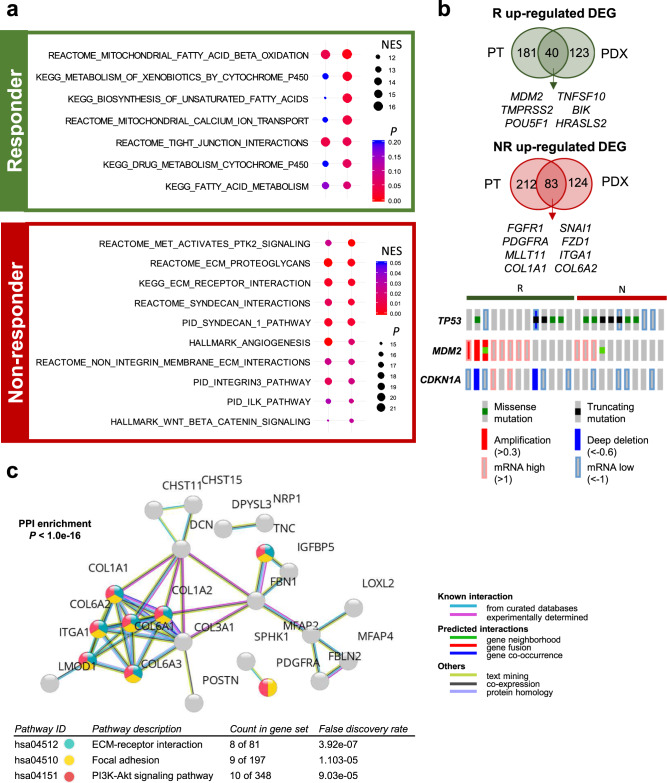
Fig. 3. Identification of response-associated gene expression features for 5-FU and oxaliplatin-based chemotherapy.
a Gene set enrichment analysis (GSEA) of the R versus NR PDX models, using RNA sequencing data. GSEA demonstrated that metabolism-related pathways were enriched in the R group and Wnt/β-catenin and angiogenesis signaling pathways were enriched in the NR group. Normalized enrichment score (NES) and nominal P value is described. b Identification of core differentially expressed genes (DEGs) between the R and NR groups in both patient tumors and PDX tumors (Top). A total of 40 upregulated genes were identified in the R group and 83 upregulated genes were identified in the NR group. The bottom panel shows the genetic and transcriptomic alterations in TP53-associated genes in the R and NR groups. c Protein–protein interaction enrichment analysis based on STRING network for the 83 DEGs that are upregulated in the NR group. Enrichment P value are corrected for multiple testing using the method of Benjamini and Hochberg.

