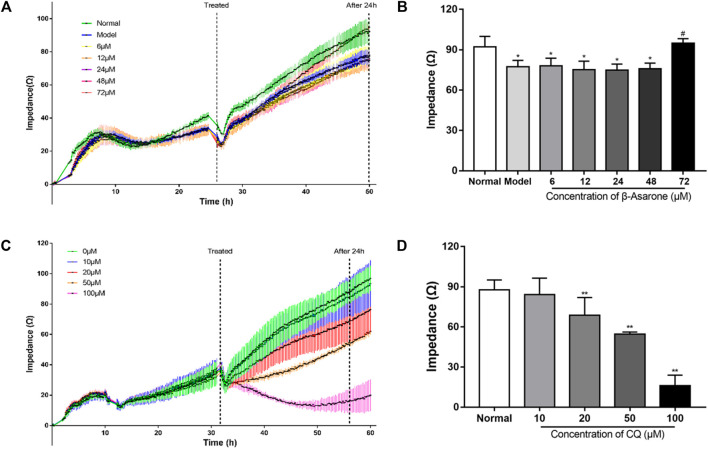
FIGURE 2.
Determination of the optimal administration conditions for drugs. (A, B) The concentration and time of β-asarone were determined by impedance-based cell analysis (compared with the normal group, * p < 0.05; compared with the model group, # p < 0.05, n = 6). (C, D) The concentration and time of CQ were determined by impedance-based cell analysis (compared with the normal group, ** p < 0.01, n = 6).

