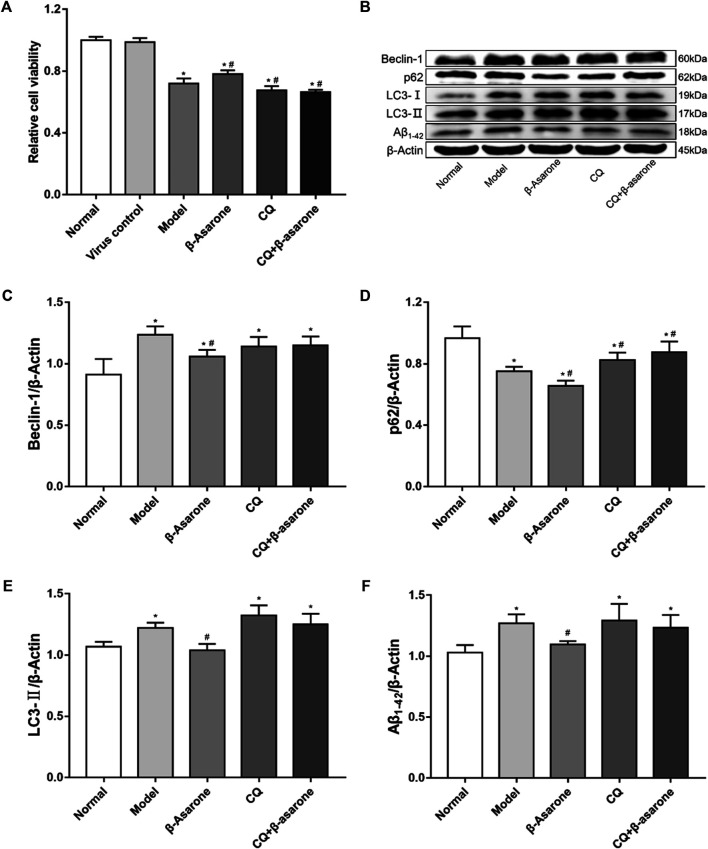
FIGURE 3.
Alterations in cell viability and expression of autophagic flux-related proteins. (A) The effect of β-asarone on cell viability was determined by CCK-8 assay (compared with the normal group, * p < 0.05; compared with the model group, # p < 0.05, n = 6). (B–F) The effect of β-asarone on autophagic flux-related proteins was assessed by western blot (compared with the normal group, * p < 0.05; compared with the model group, # p < 0.05, n ≥ 4).

