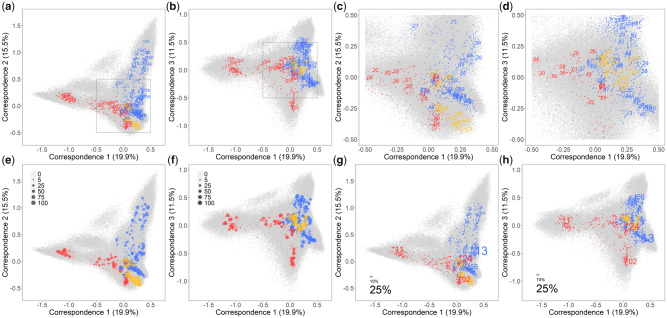
Fig. 2.
FCA of peptide-binding affinity data for 2,909 HLA Class I molecules using 200,000 simulated peptides with two of the first three correspondences visualized, respectively, representing together ∼50% of the total variance. Both HLA molecules and peptides are plotted, distinguished by colors (red for HLA-A, blue for HLA-B, yellow for HLA-C, and gray for peptides). Only the most common molecule belonging to each HLA-A and HLA-B lineage is labeled by the first-field names (a, b), then the gray framed central part zoomed in with one molecule for each HLA-A, HLA-B, and HLA-C lineage labeled similarly (c, d), and next, for each HLA molecule, the plot size is proportional to the numbers of populations in which its corresponding allele was observed (e, f), and finally, as an example of their population distribution, the HLA molecules are highlighted by labels of different sizes proportional to the allele frequencies they correspond in an Australian Aboriginal population from Cape York Peninsula (g, h).

