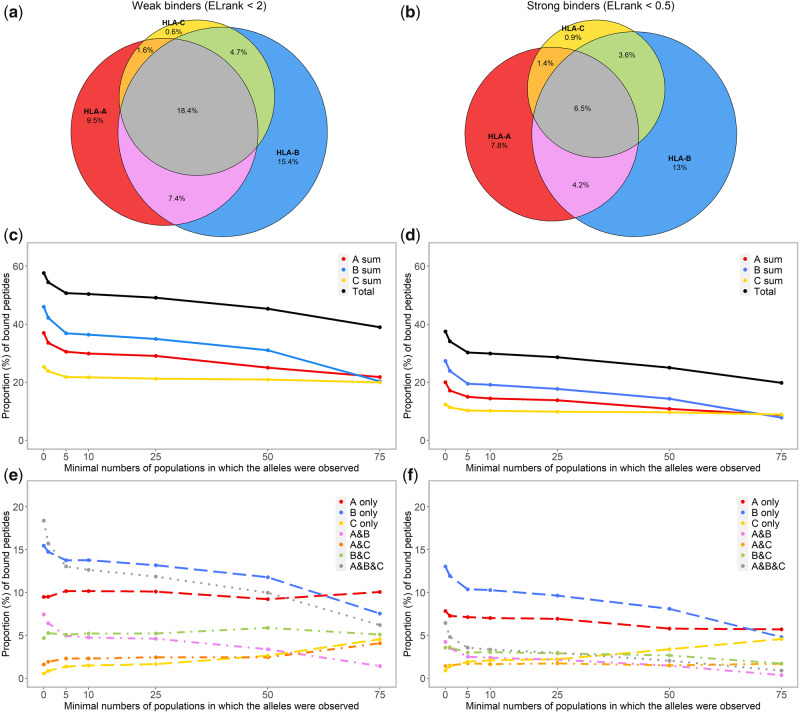
Fig. 3.
Venn diagrams showing, with two upper thresholds of the rank of predicted binding score (ELrank < 2, for weak binders and ELrank < 0.5 for strong binders), the absolute proportion of peptides, among 200,000 random ones, which are predicted to bind at least one of the 2,909 HLA-A, HLA-B, or HLA-C molecules, respectively, and the proportion of peptides that might bind HLA molecules of two (A&B, A&C, and B&C) or three (A&B&C) genes (a: weak binders; b: strong binders). The proportion of peptides estimated similarly for different categories of HLA molecules characterized by the range of distribution in populations are further summarized by line charts (c, e: weak binders; d, f: strong binders).

